 Ankit Gandhi
Systems Thinking: RGZP
A systems-thinking study of Rajiv Gandhi Zoological Park in Pune, leading to a collectible ticket, a mascot and an AR app for visitors.
Project at MIT Institute of Design.
Overview
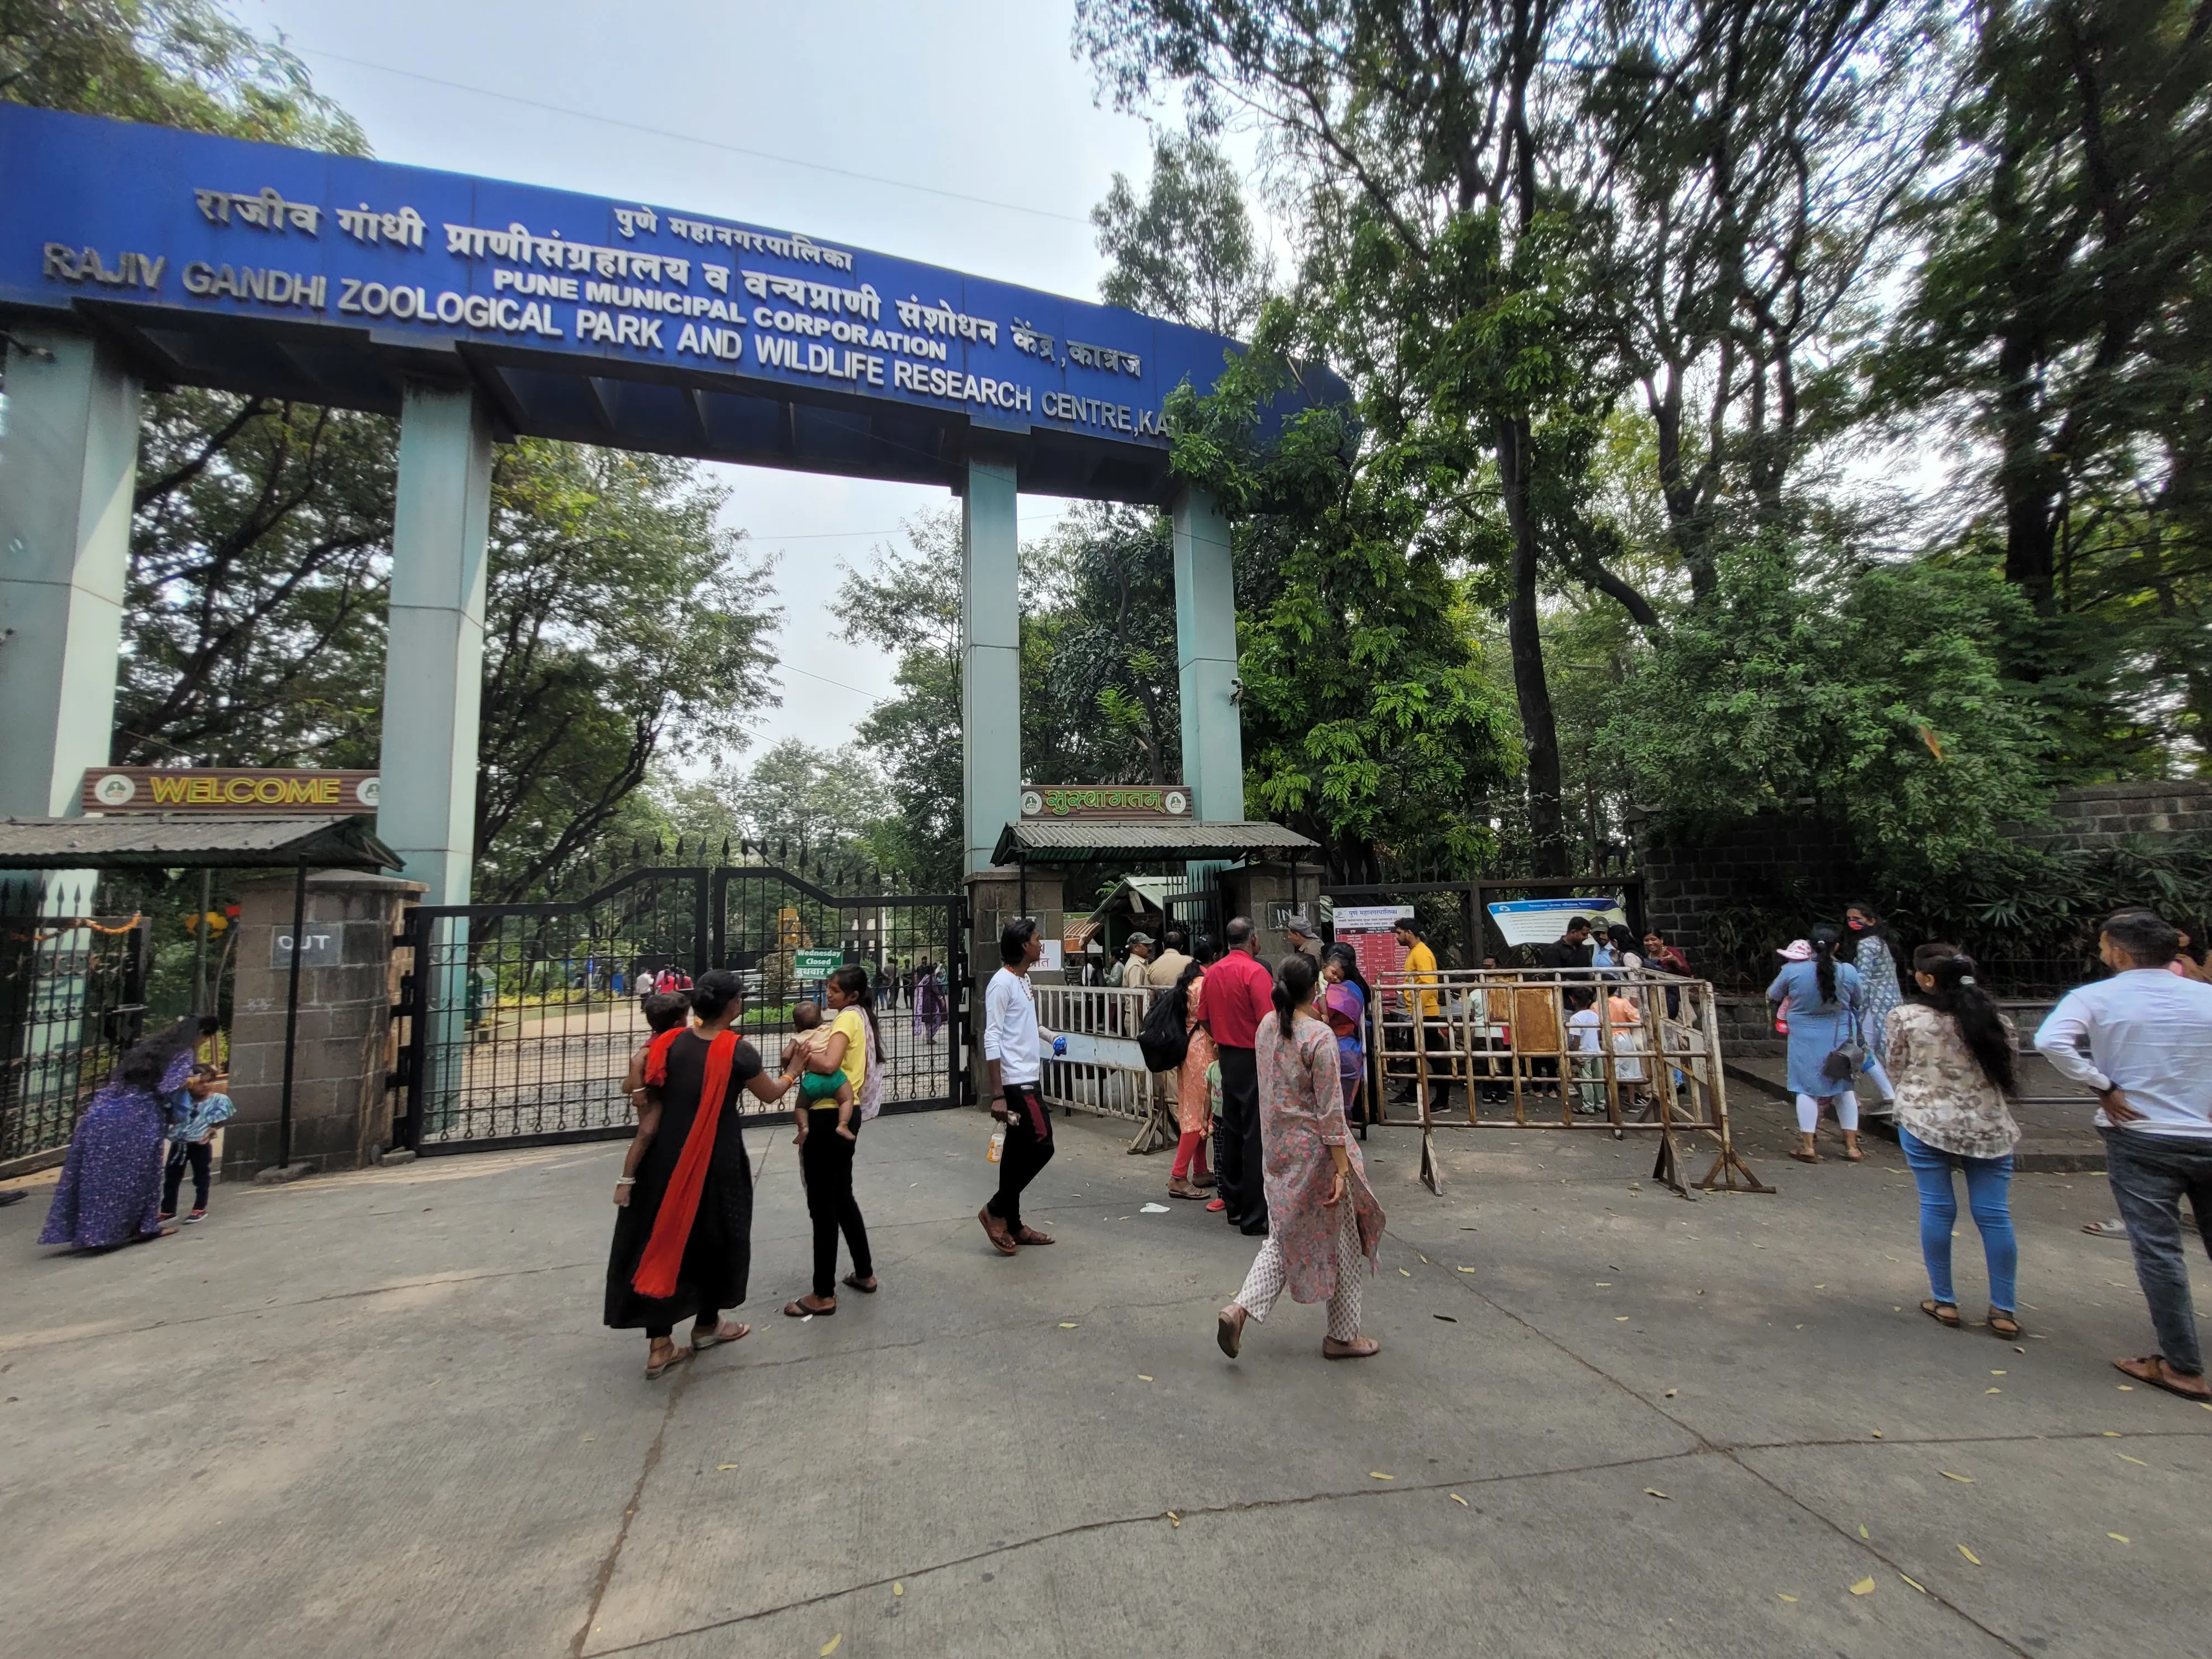
Rajiv Gandhi Zoological Park, known as the Rajiv Gandhi Zoo, is a popular zoo in Pune, Maharashtra, India. It was established in 1999, is named after the former Prime Minister of India, Rajiv Gandhi, and covers about 130 acres.
This project looked at the zoo as a system, with ecological, operational, social and visitor-facing parts that all affect each other. The aim was to understand how the zoo works beyond being a place to visit: how animals, caretakers, visitors, infrastructure, education, conservation and management relate to each other.
The brief
Using a systems-thinking approach, the project set out to find hidden challenges and opportunities that could improve the visitor experience and the wellbeing of the whole ecosystem, while supporting conservation awareness through meaningful interventions.
Approach
I followed a systems-led method: understand the relationships first, find the pain points, then design interventions at more than one level of the zoo.
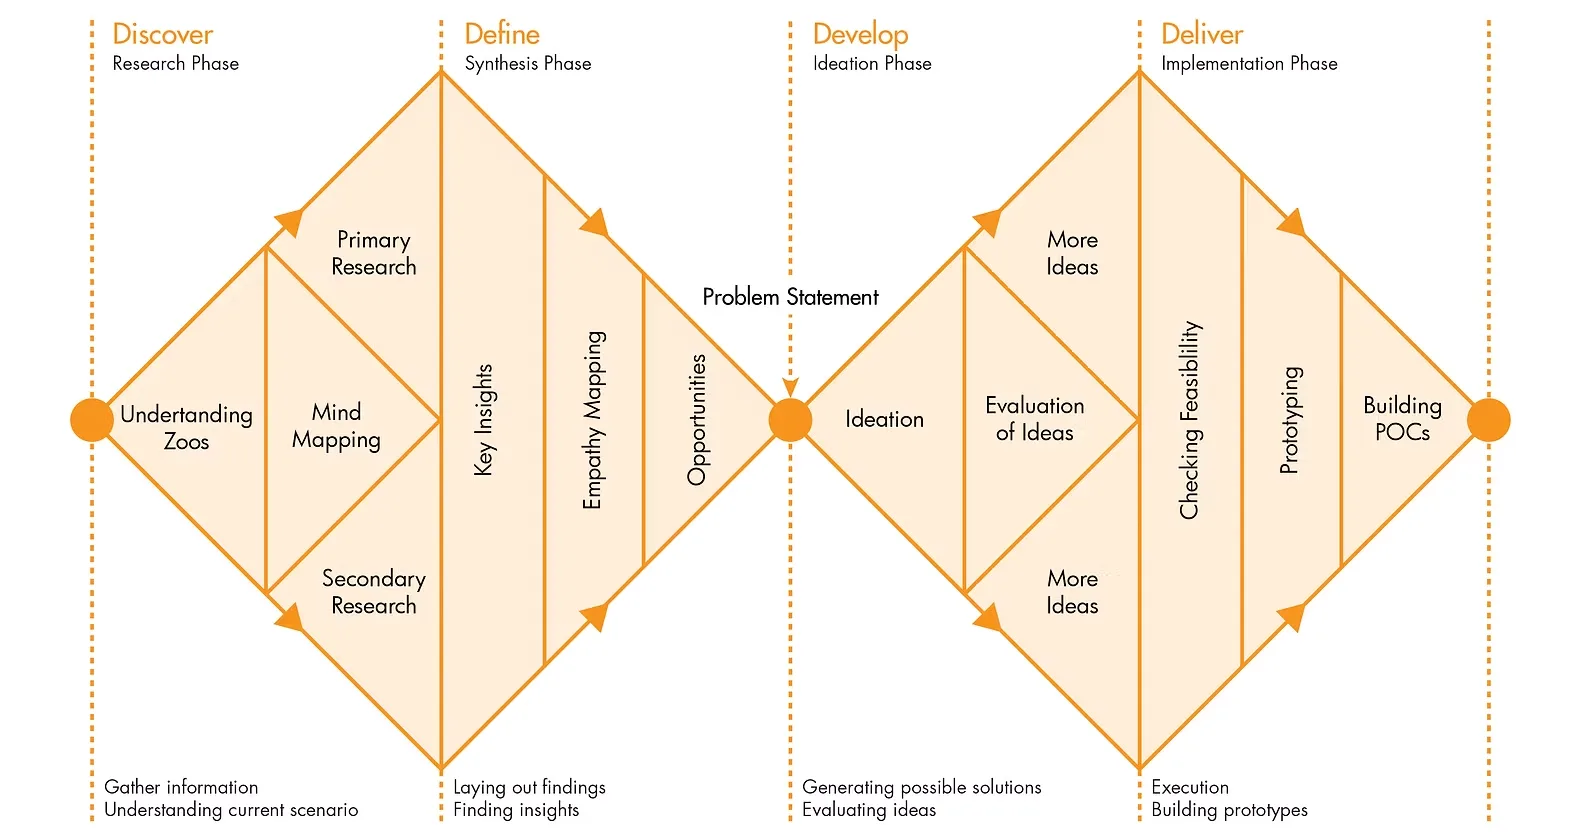
Secondary research. I studied zoo ecosystems, visitor experience design, conservation initiatives and systems thinking methods to build domain knowledge and find the challenges that were already known.
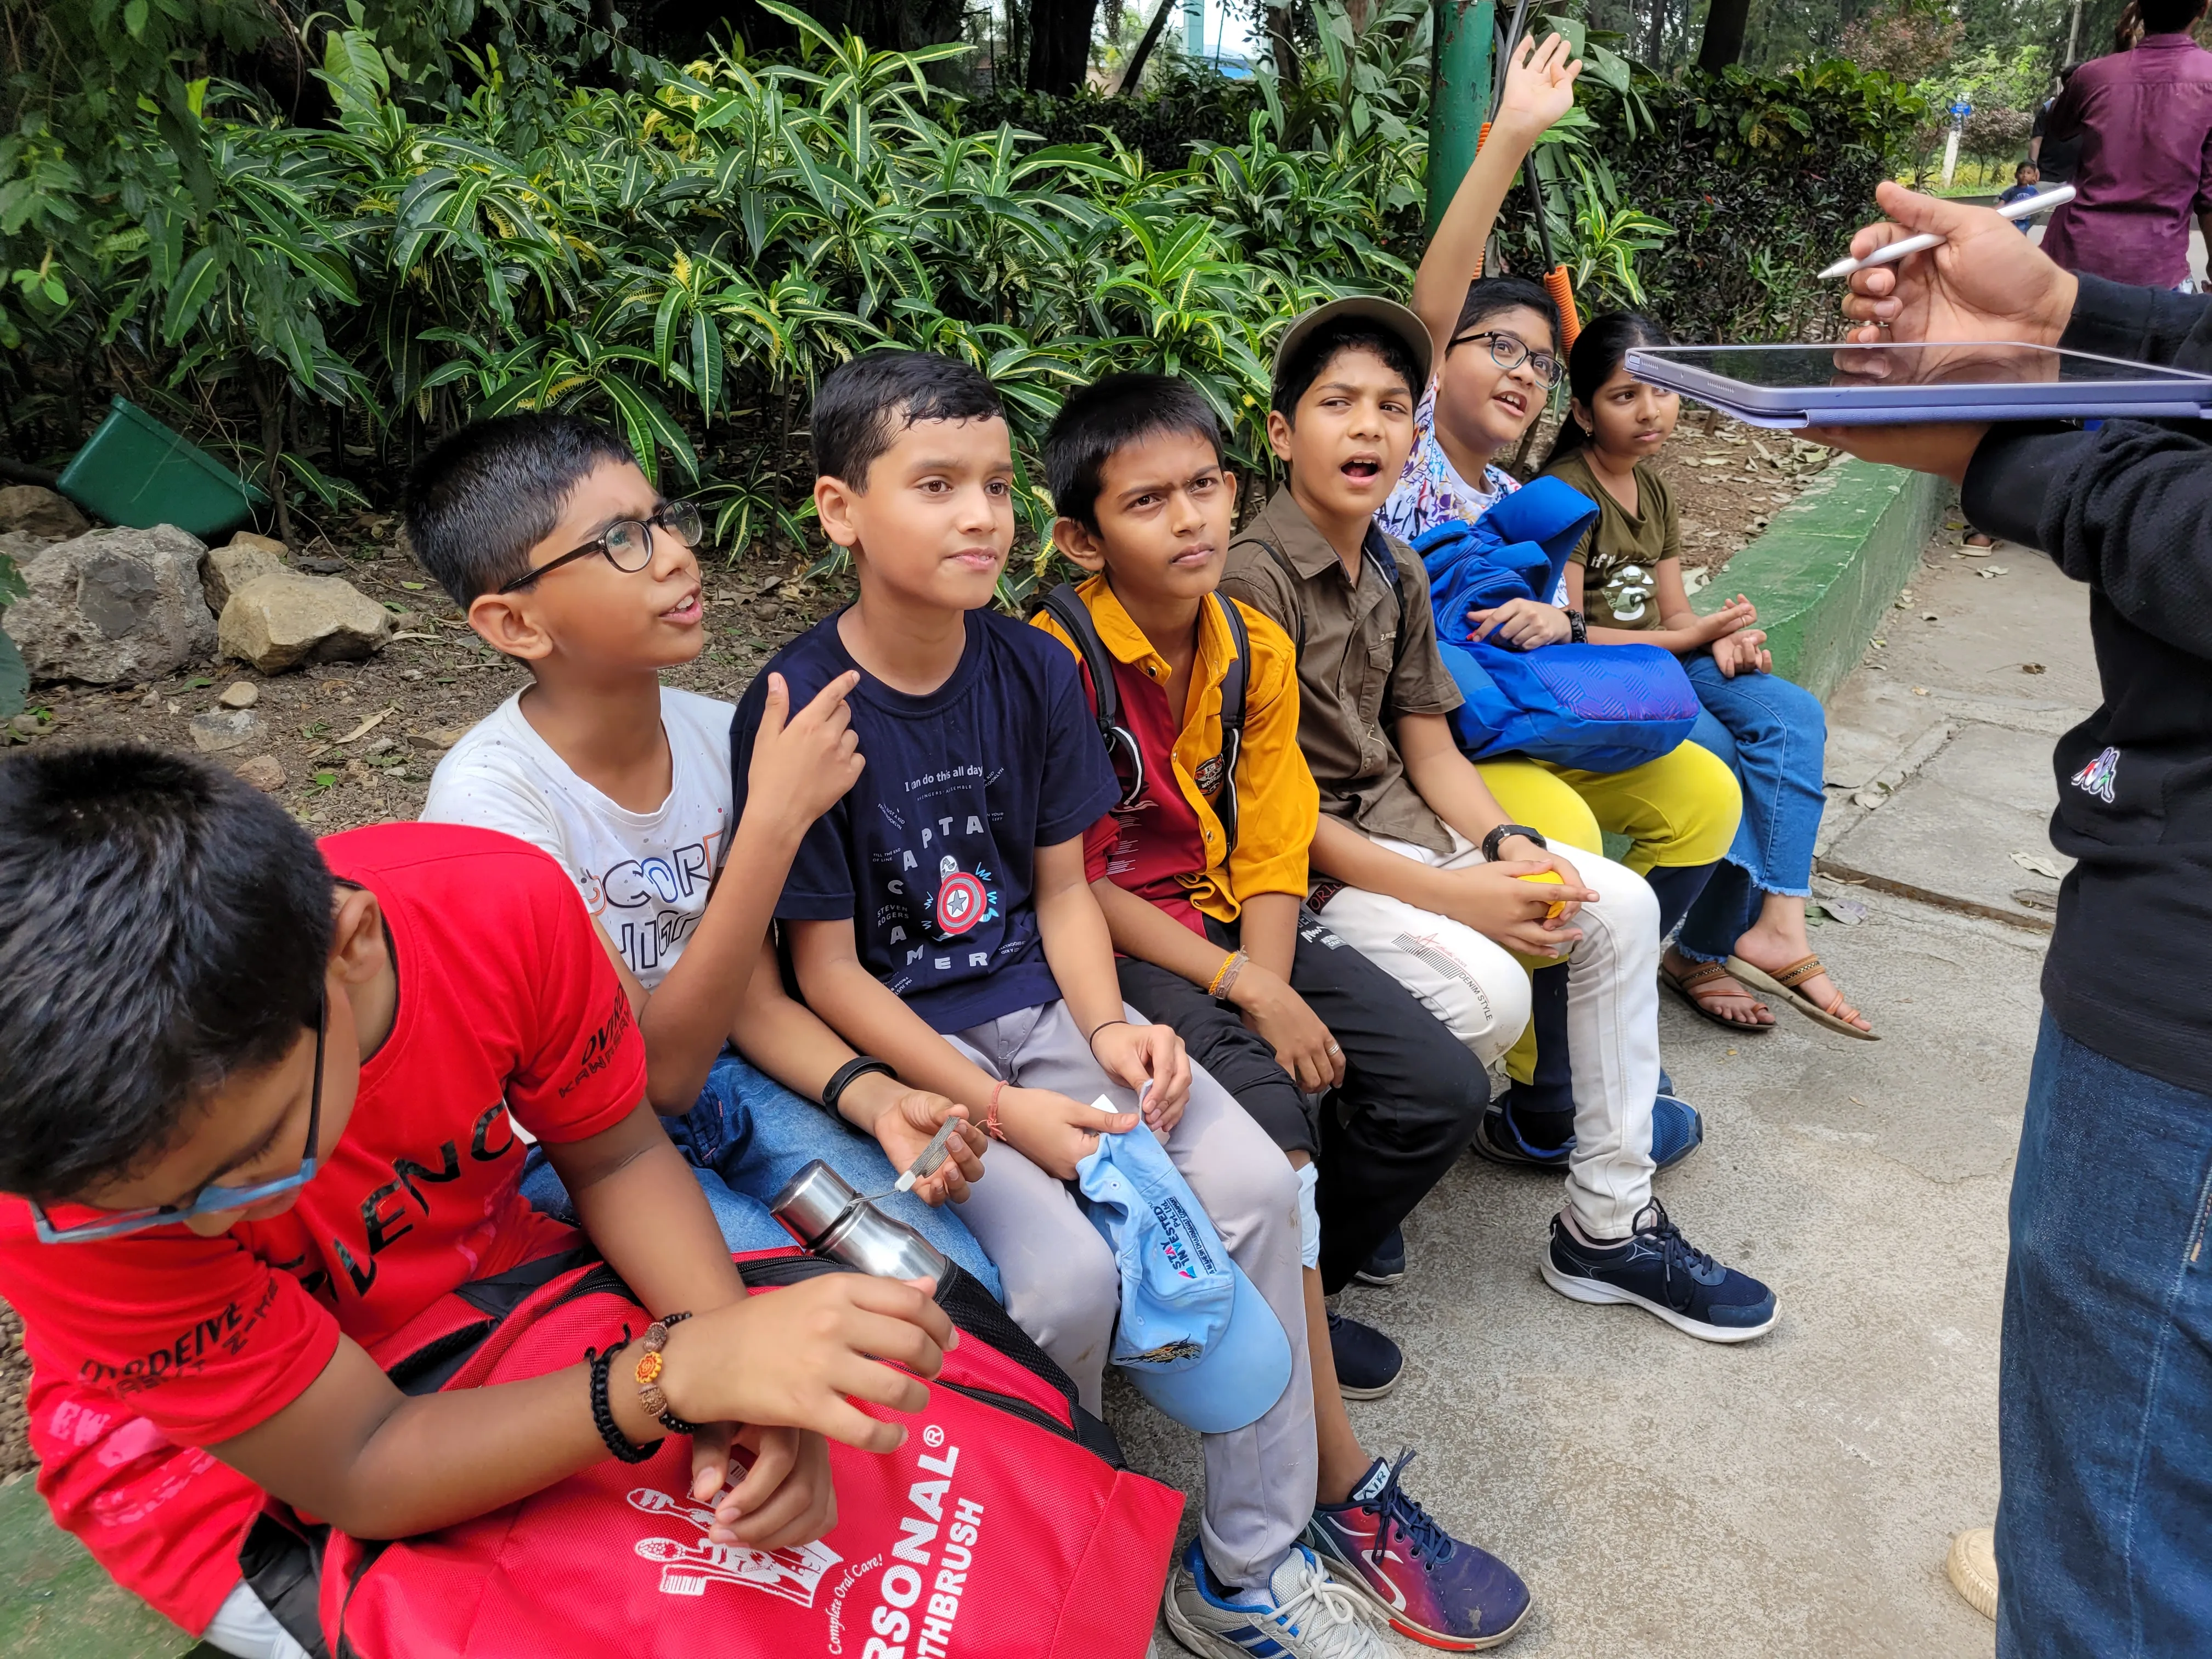
Primary research. I made site visits, observed visitors and ran contextual inquiry to see how people behave, move around and interact in the zoo.
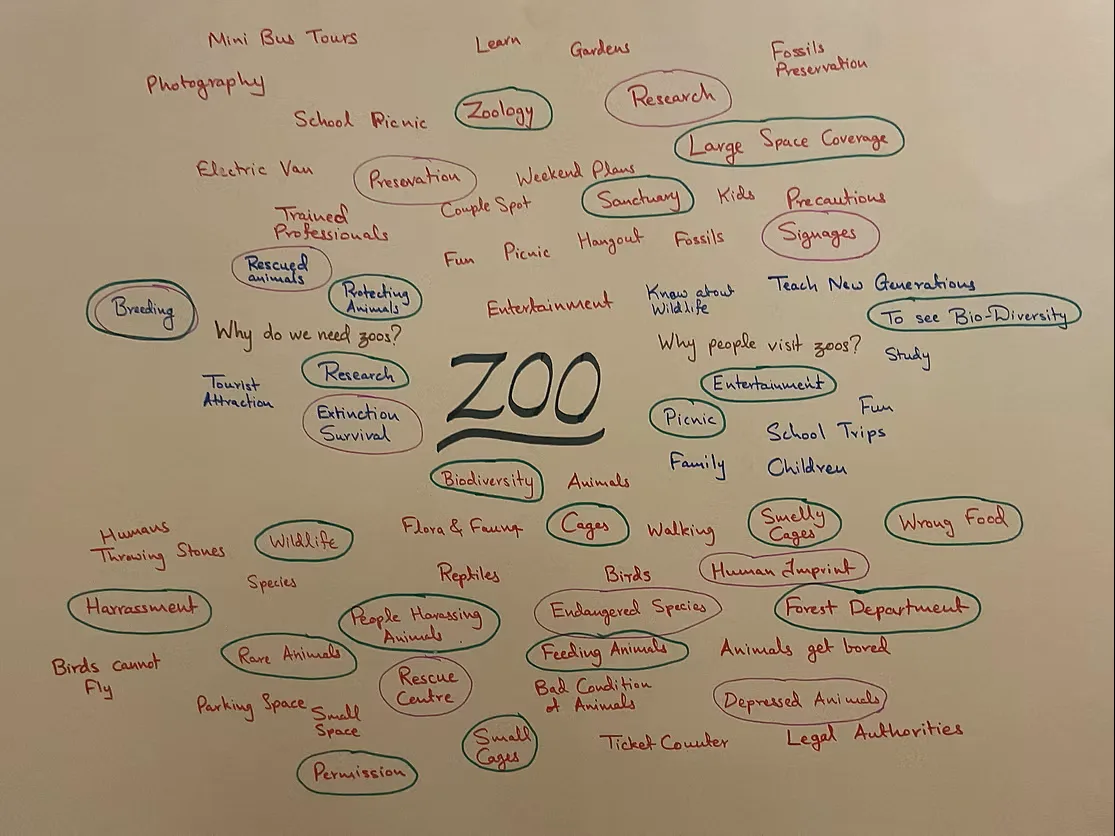
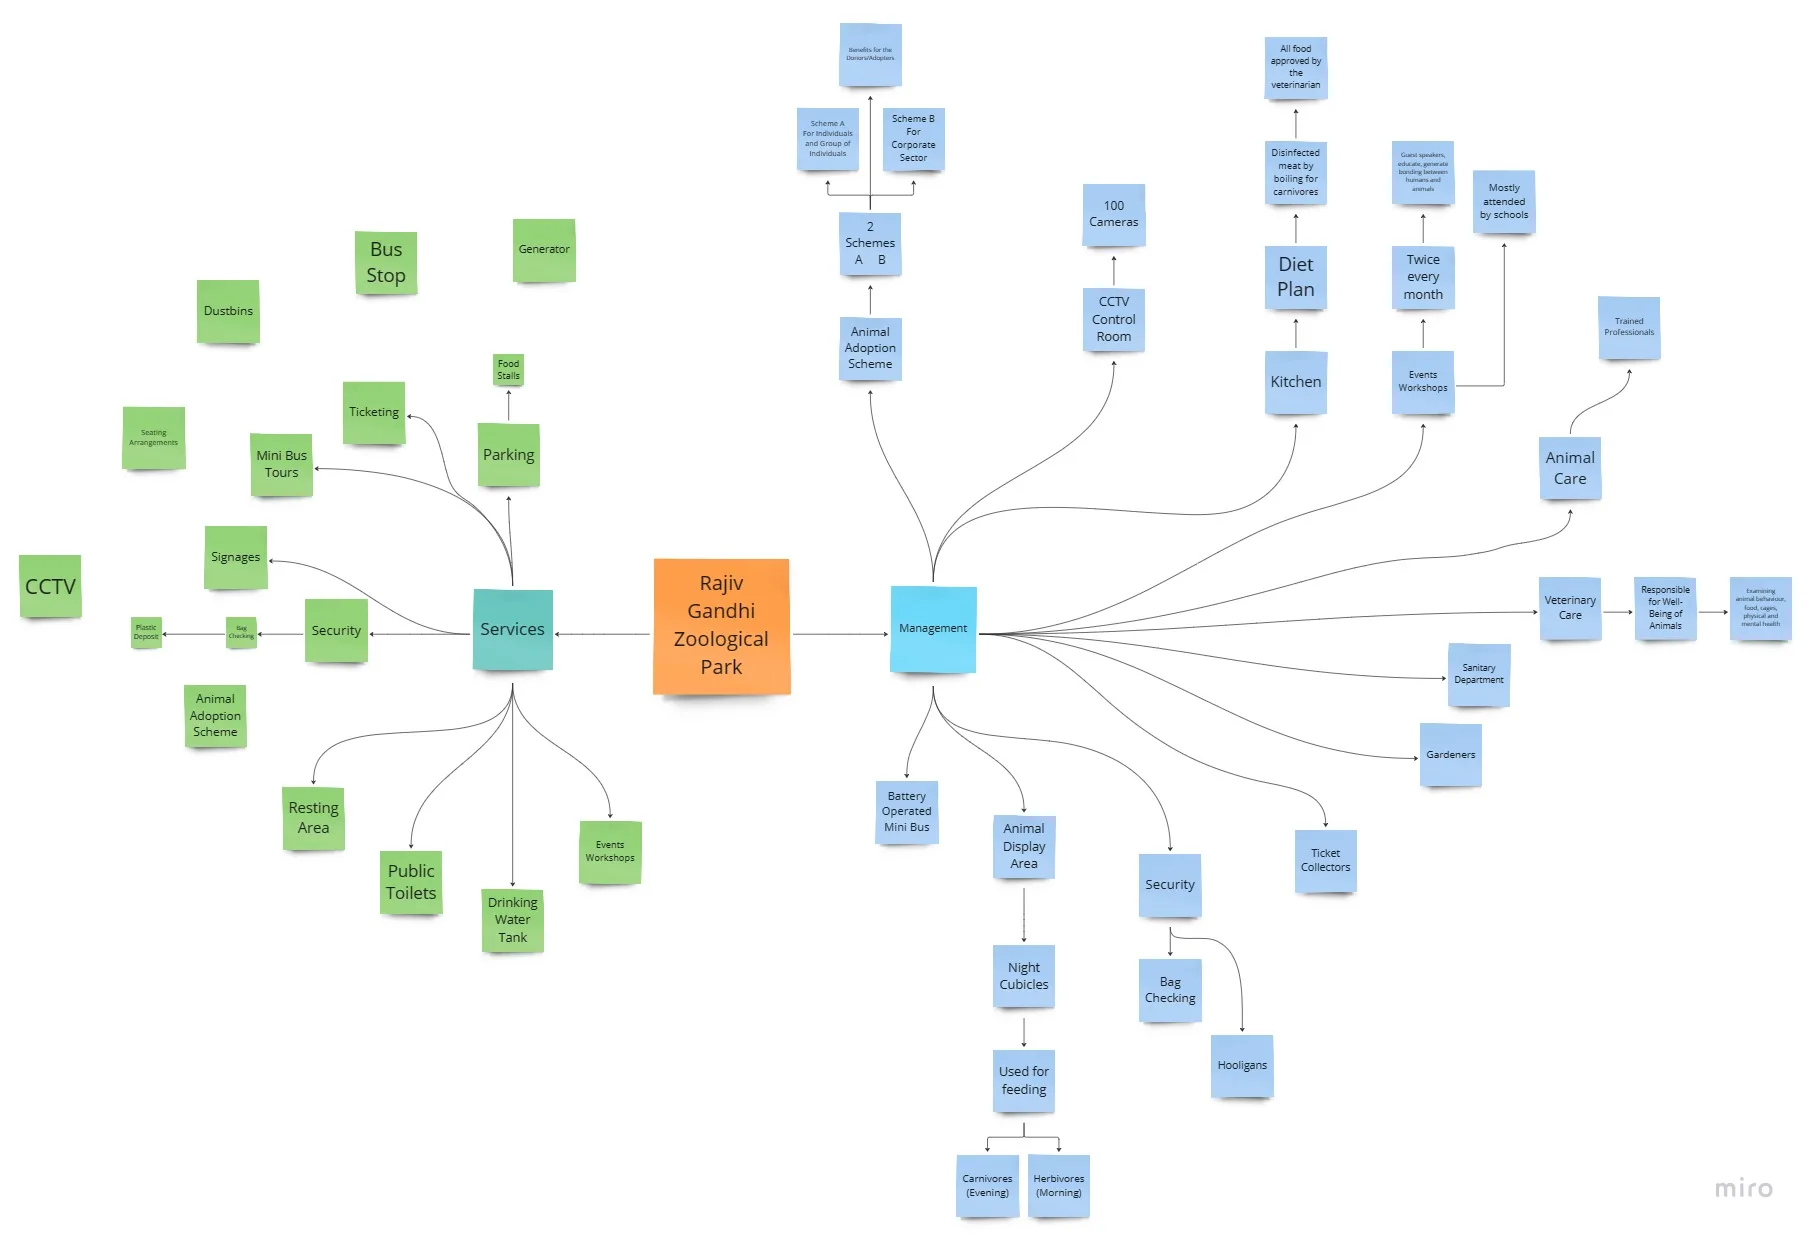
Stakeholder mapping. I mapped the relationships between visitors, animals, zoo staff, management and the systems that support them, to see who depends on and influences whom.
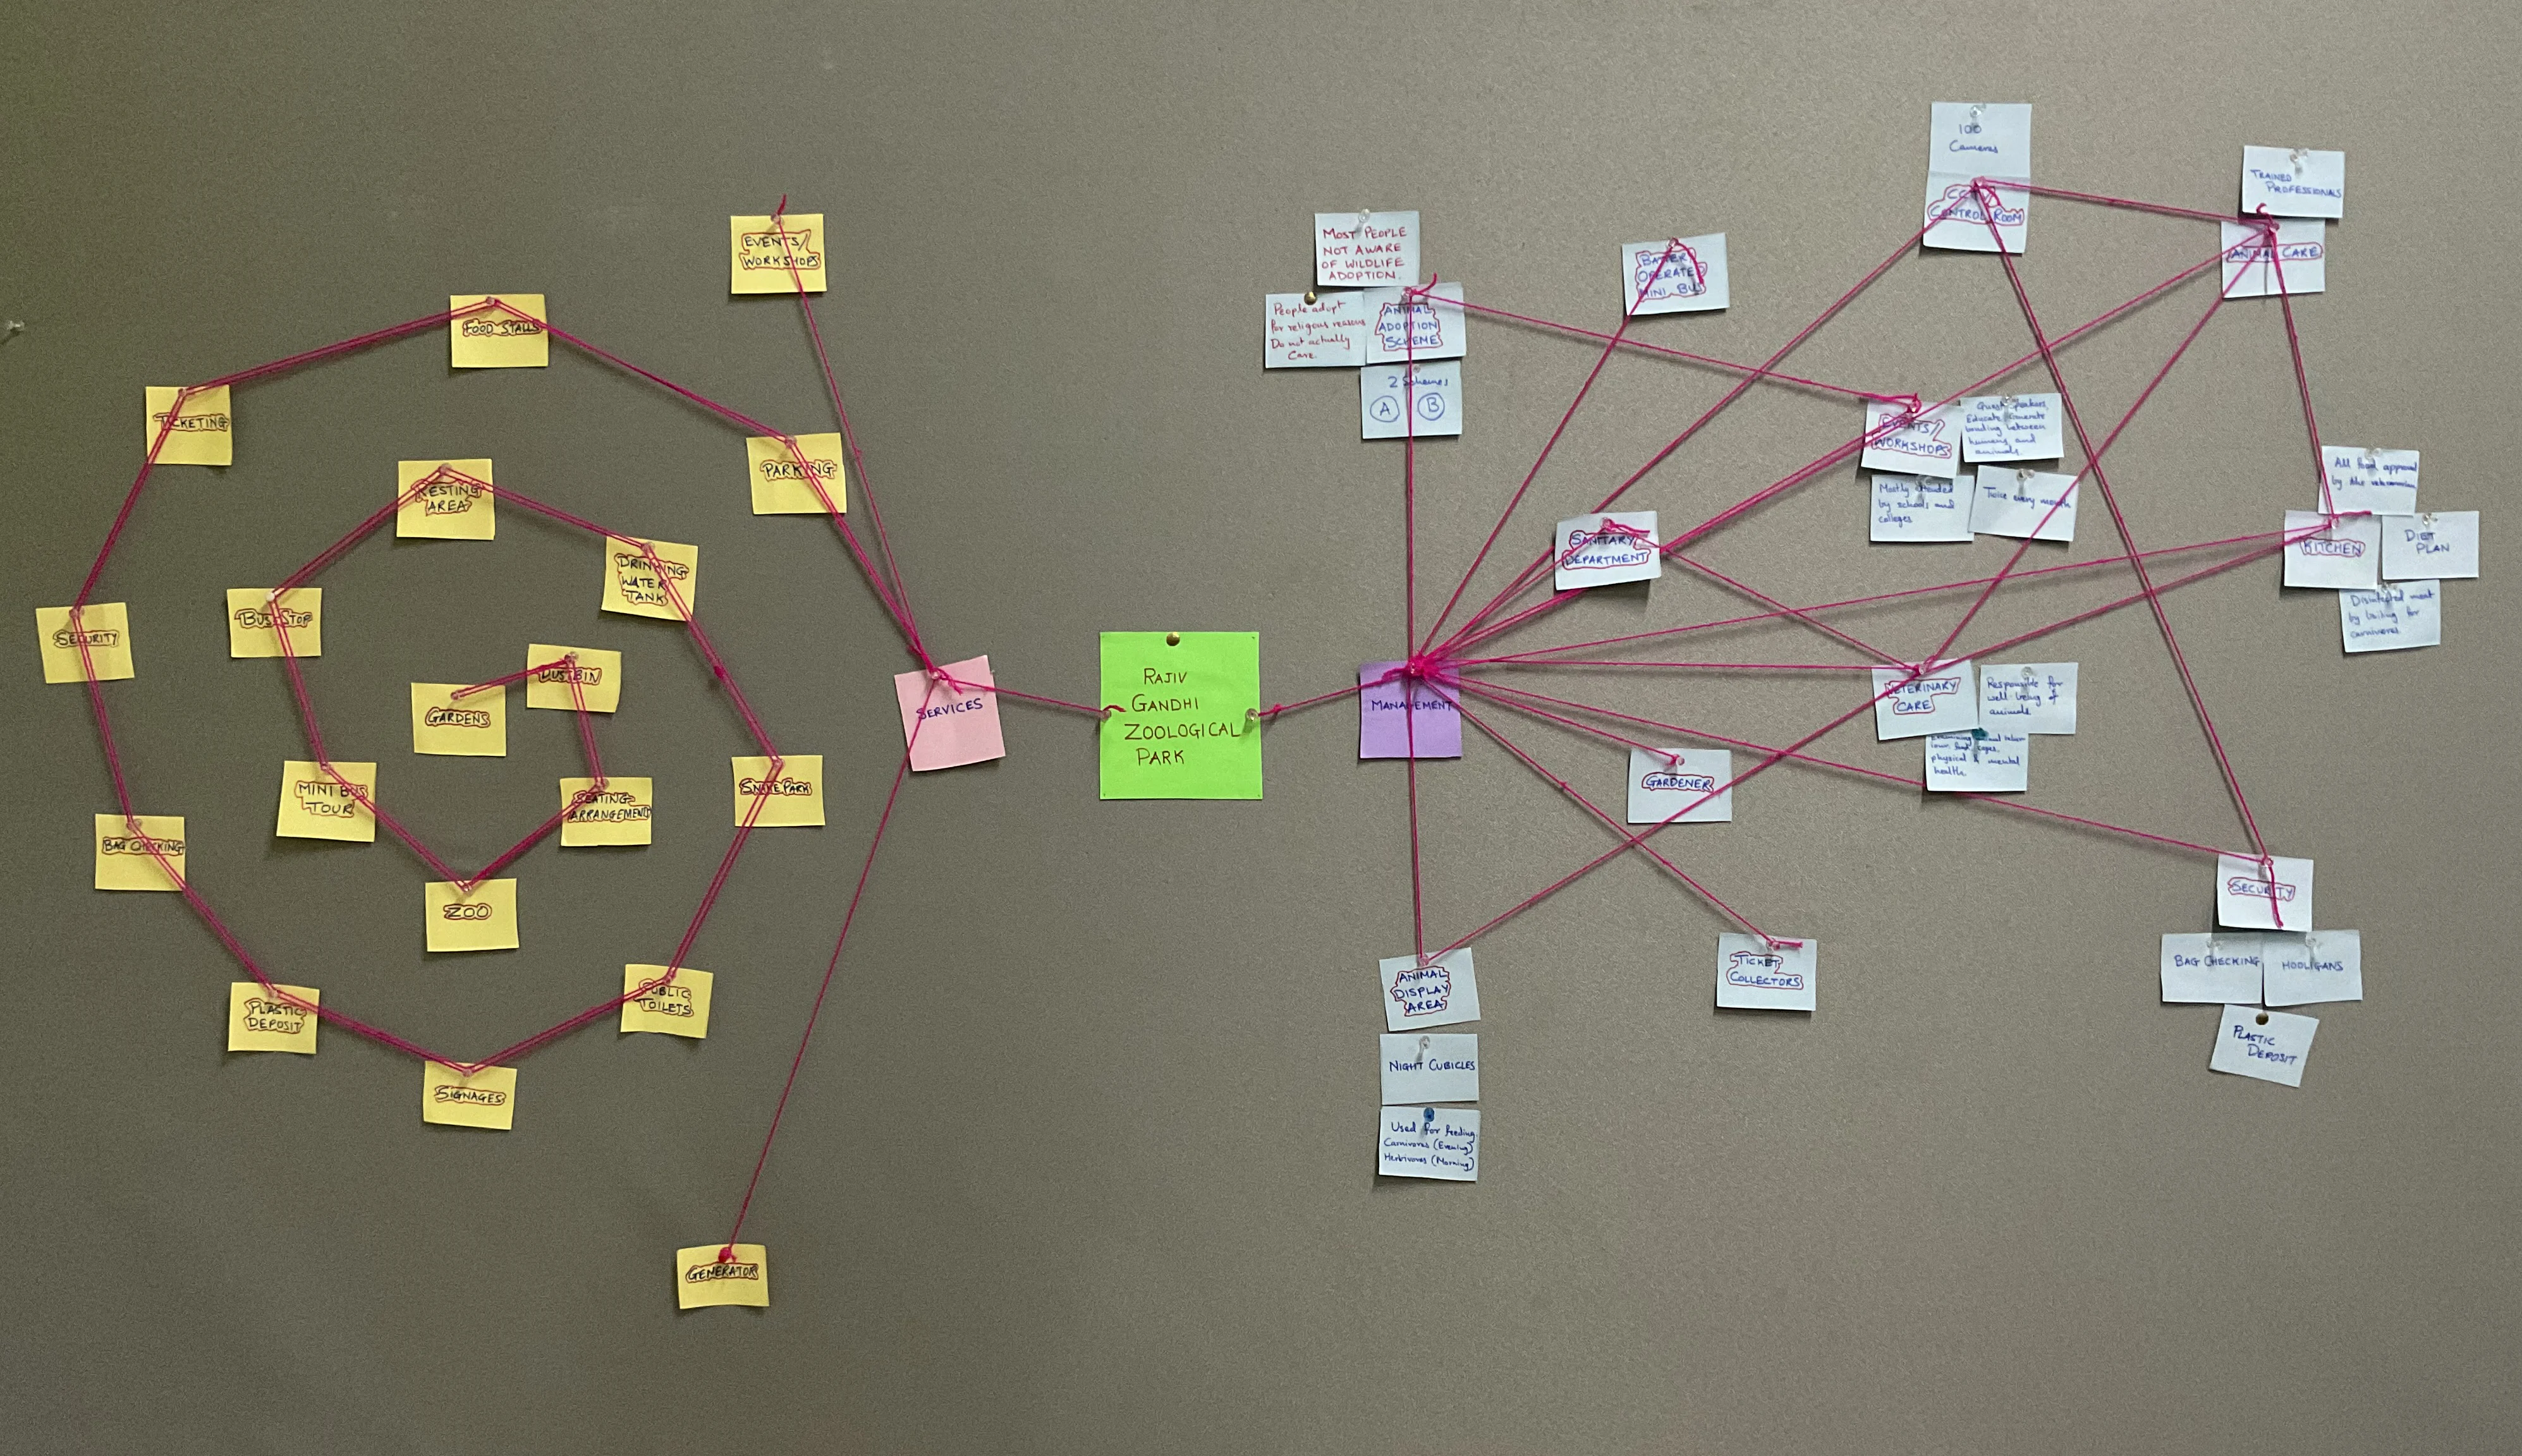
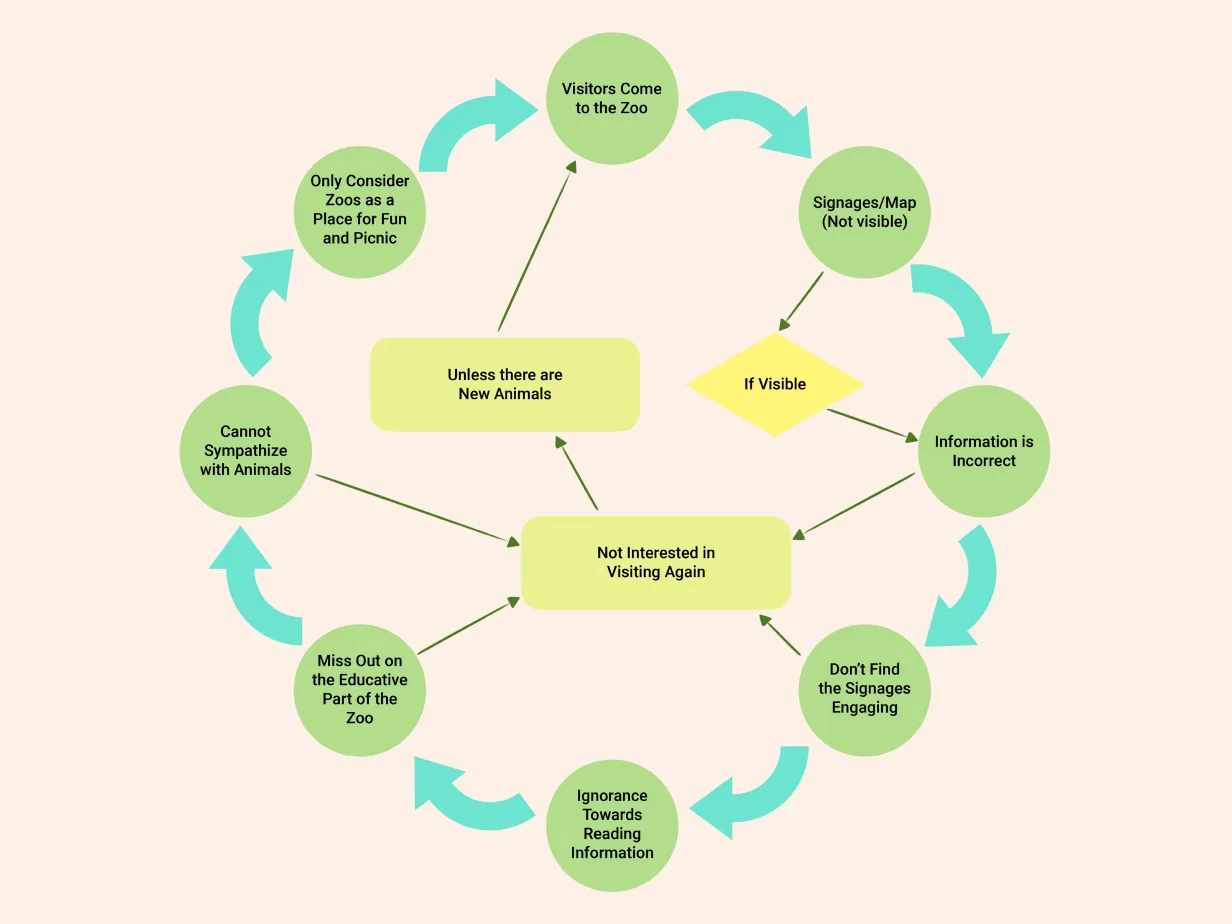
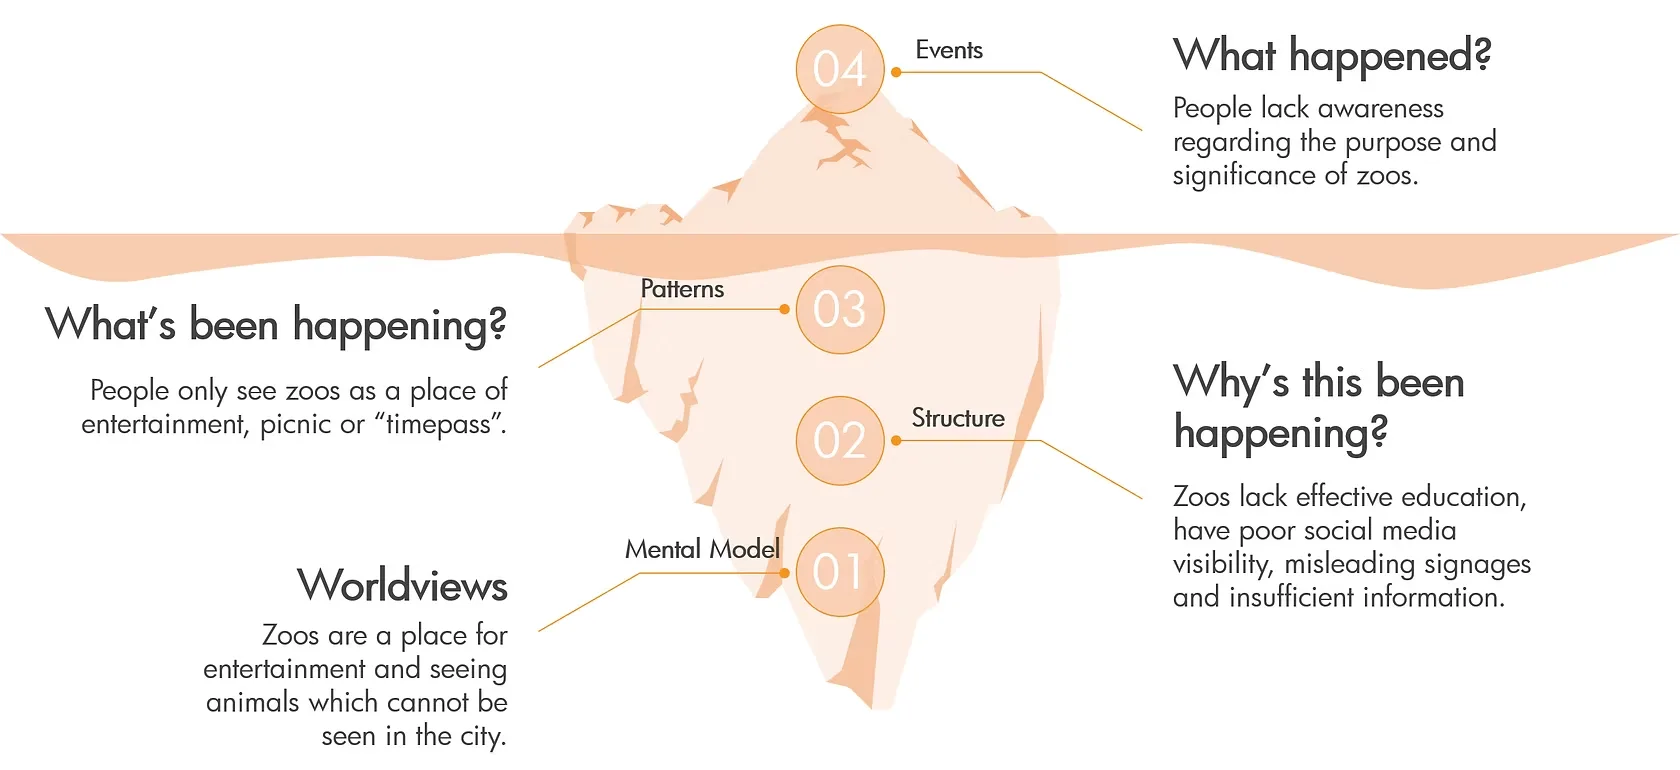
Systems analysis. I used systems maps, feedback loops and the Iceberg Model to get to root causes and find leverage points for intervention.
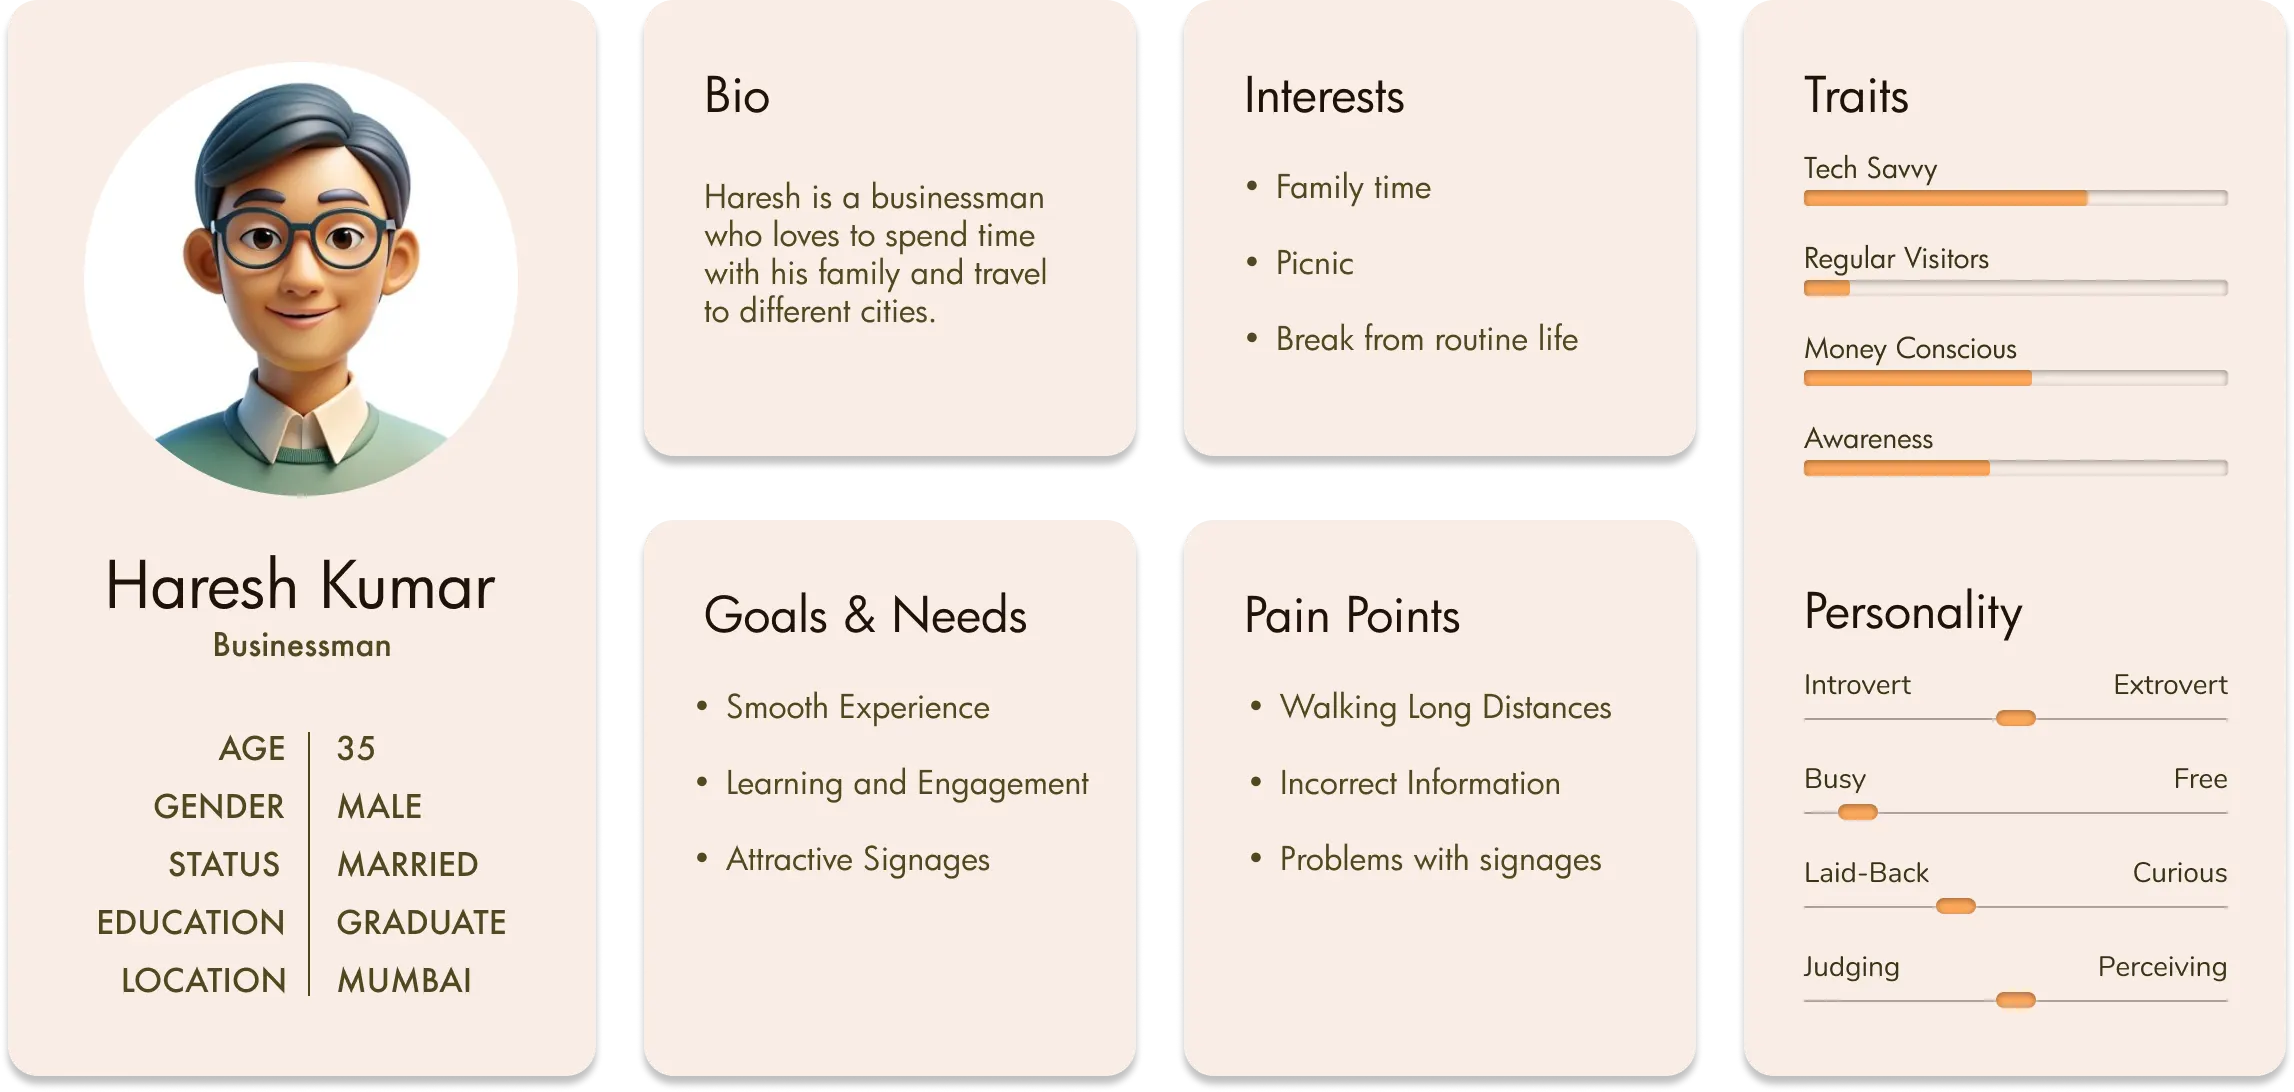
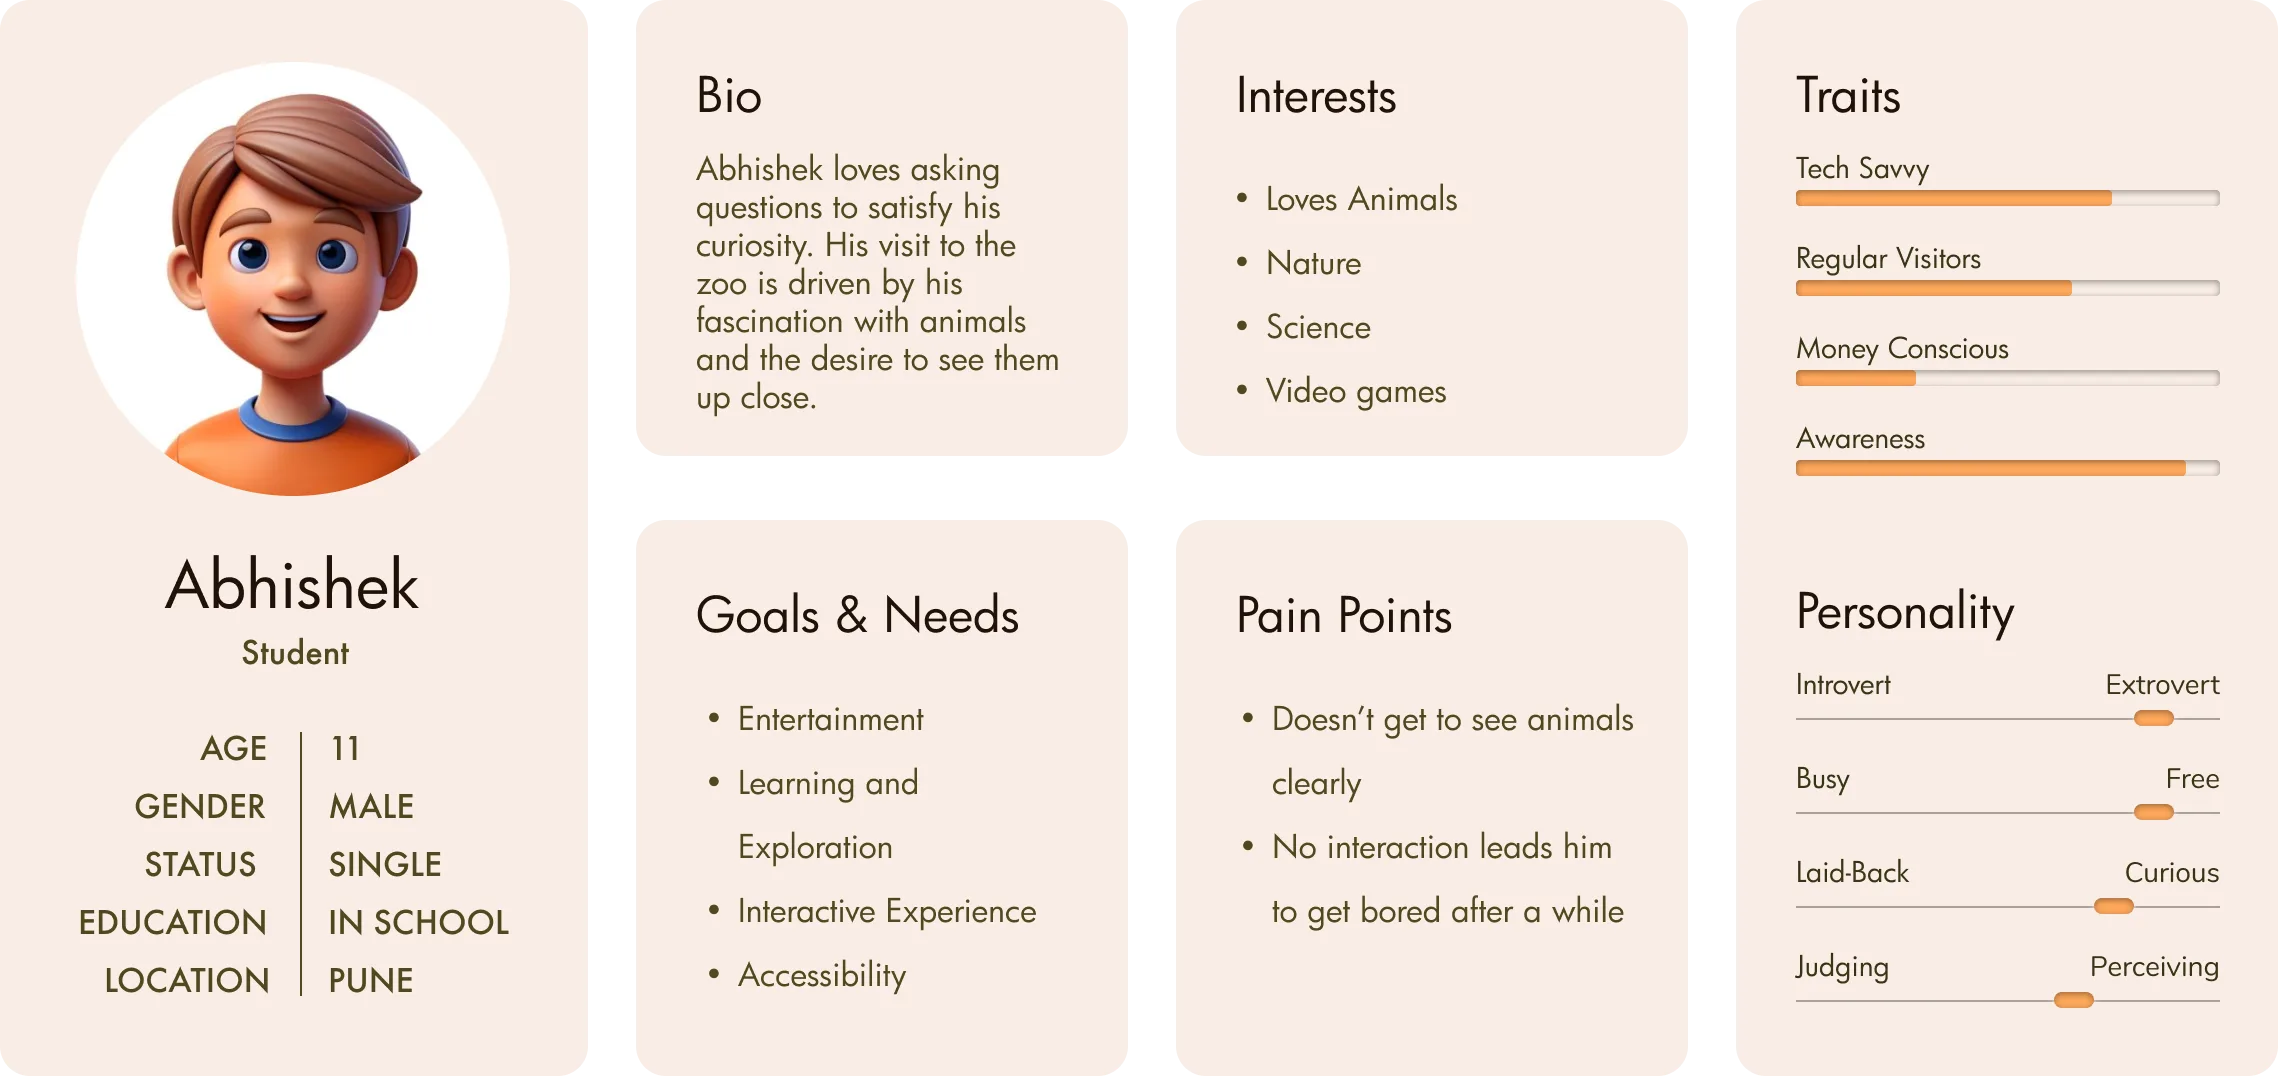
User understanding. I wrote personas and pulled together behavioural insights to understand what motivates visitors, what they need and where they struggle.
Opportunity areas. I turned the findings into four opportunity areas: engagement, education, accessibility and conservation awareness.
The solution
The result is a set of ideas that work together to improve engagement, education and awareness across the zoo: a collectible ticket, a mascot and an app.
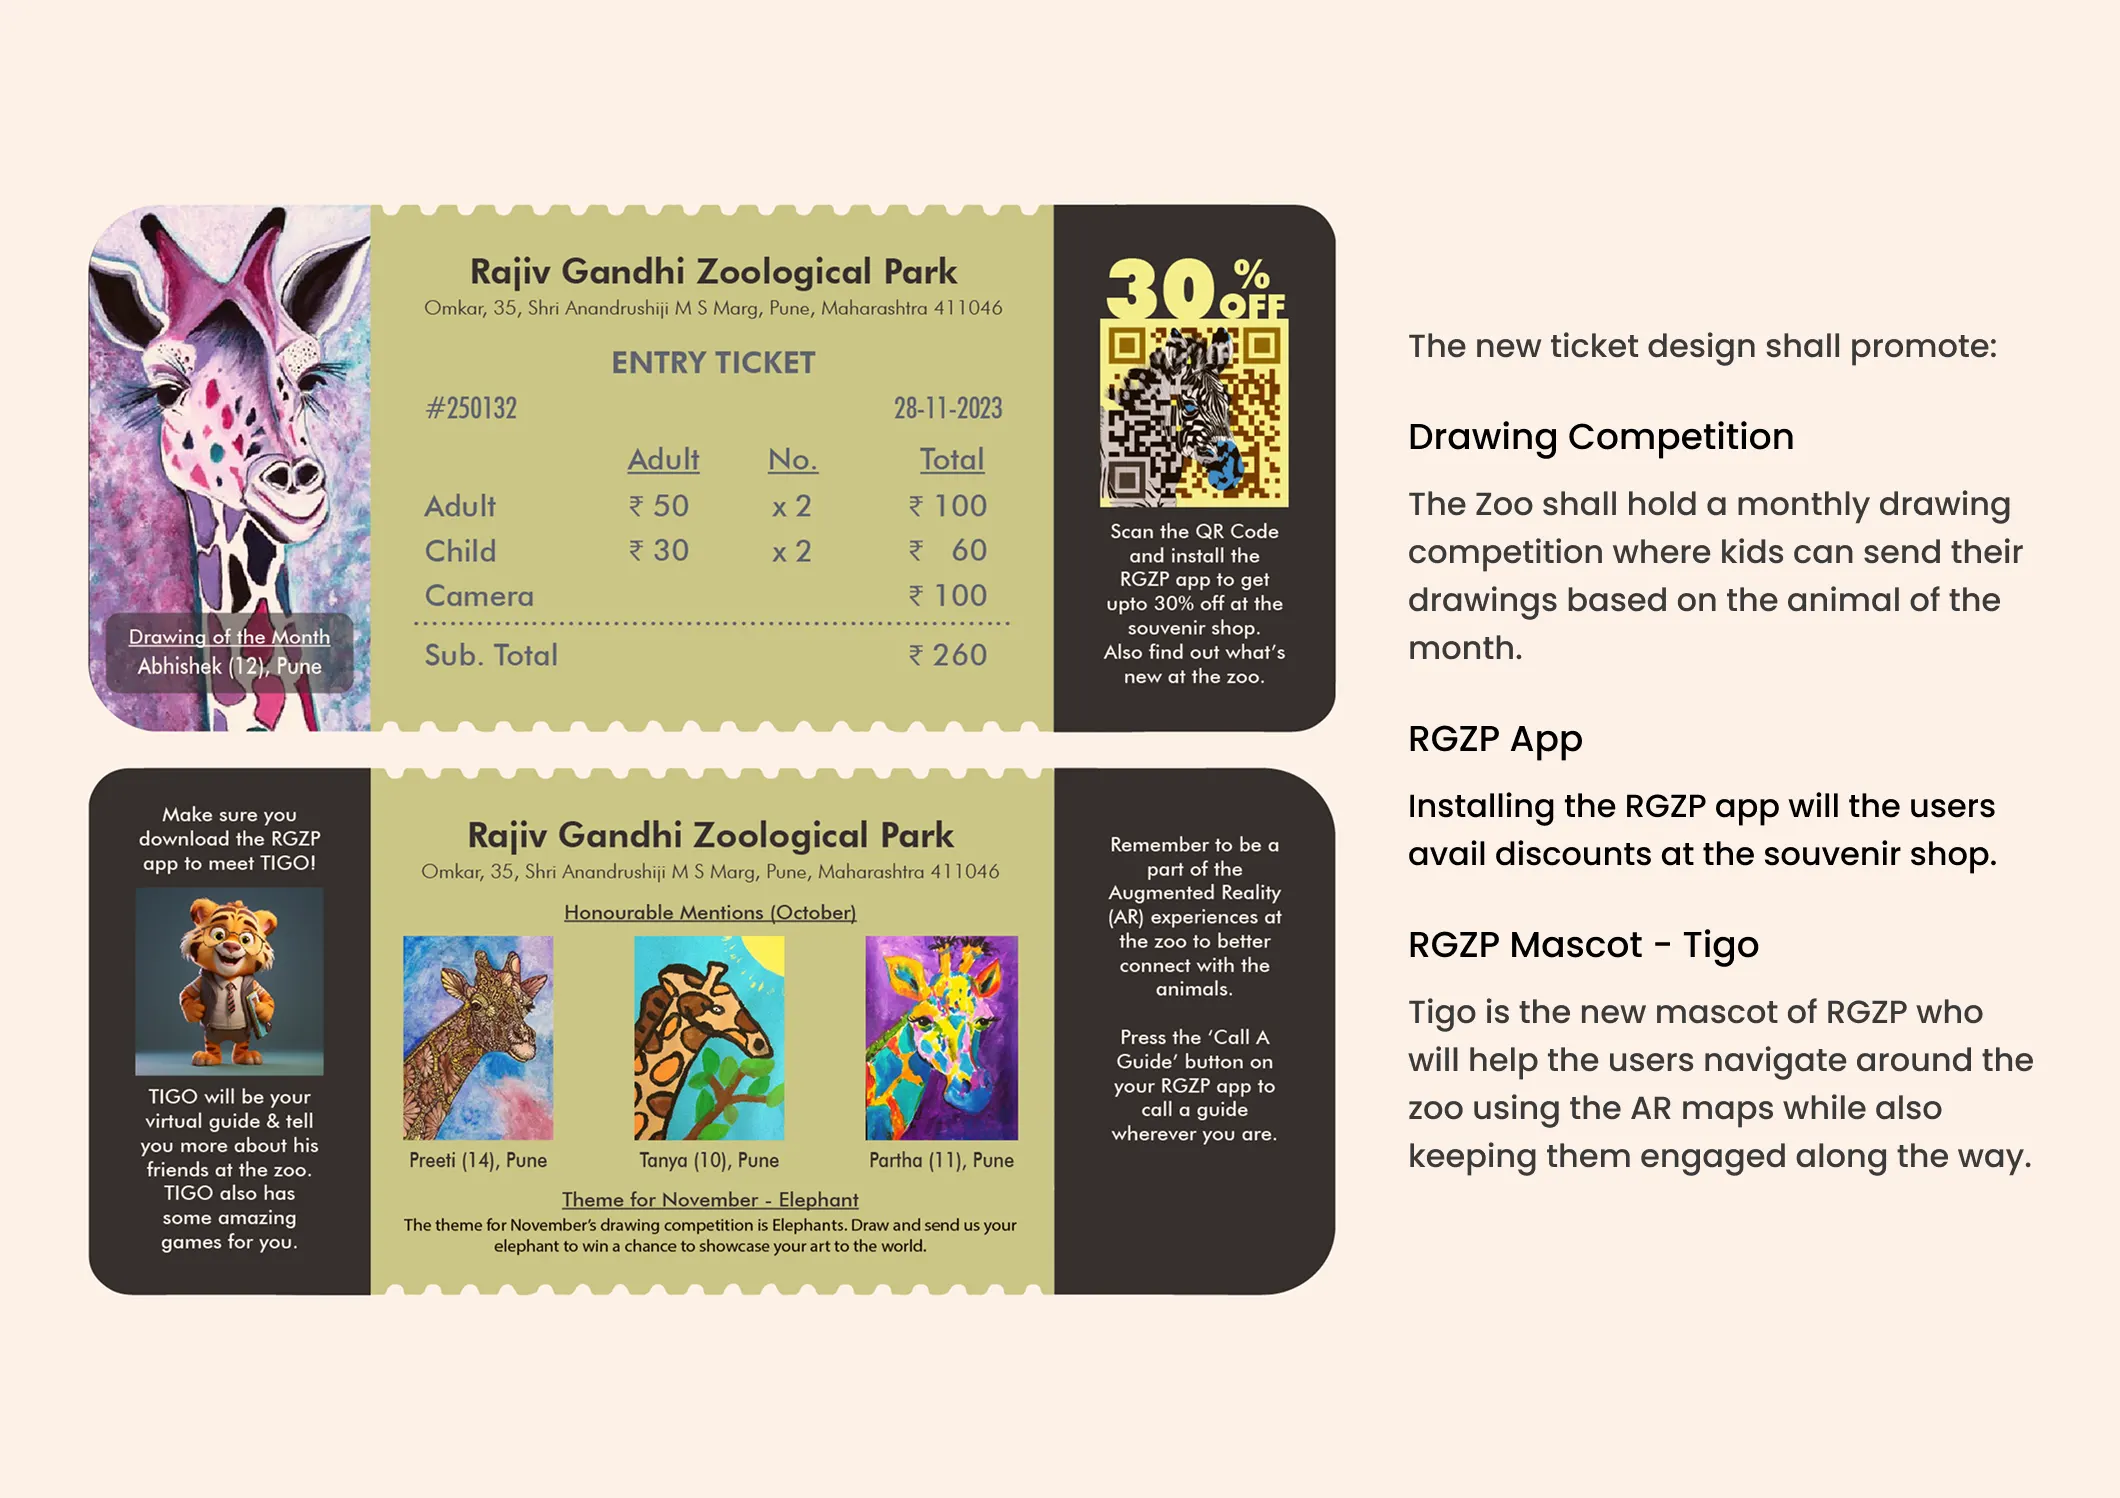
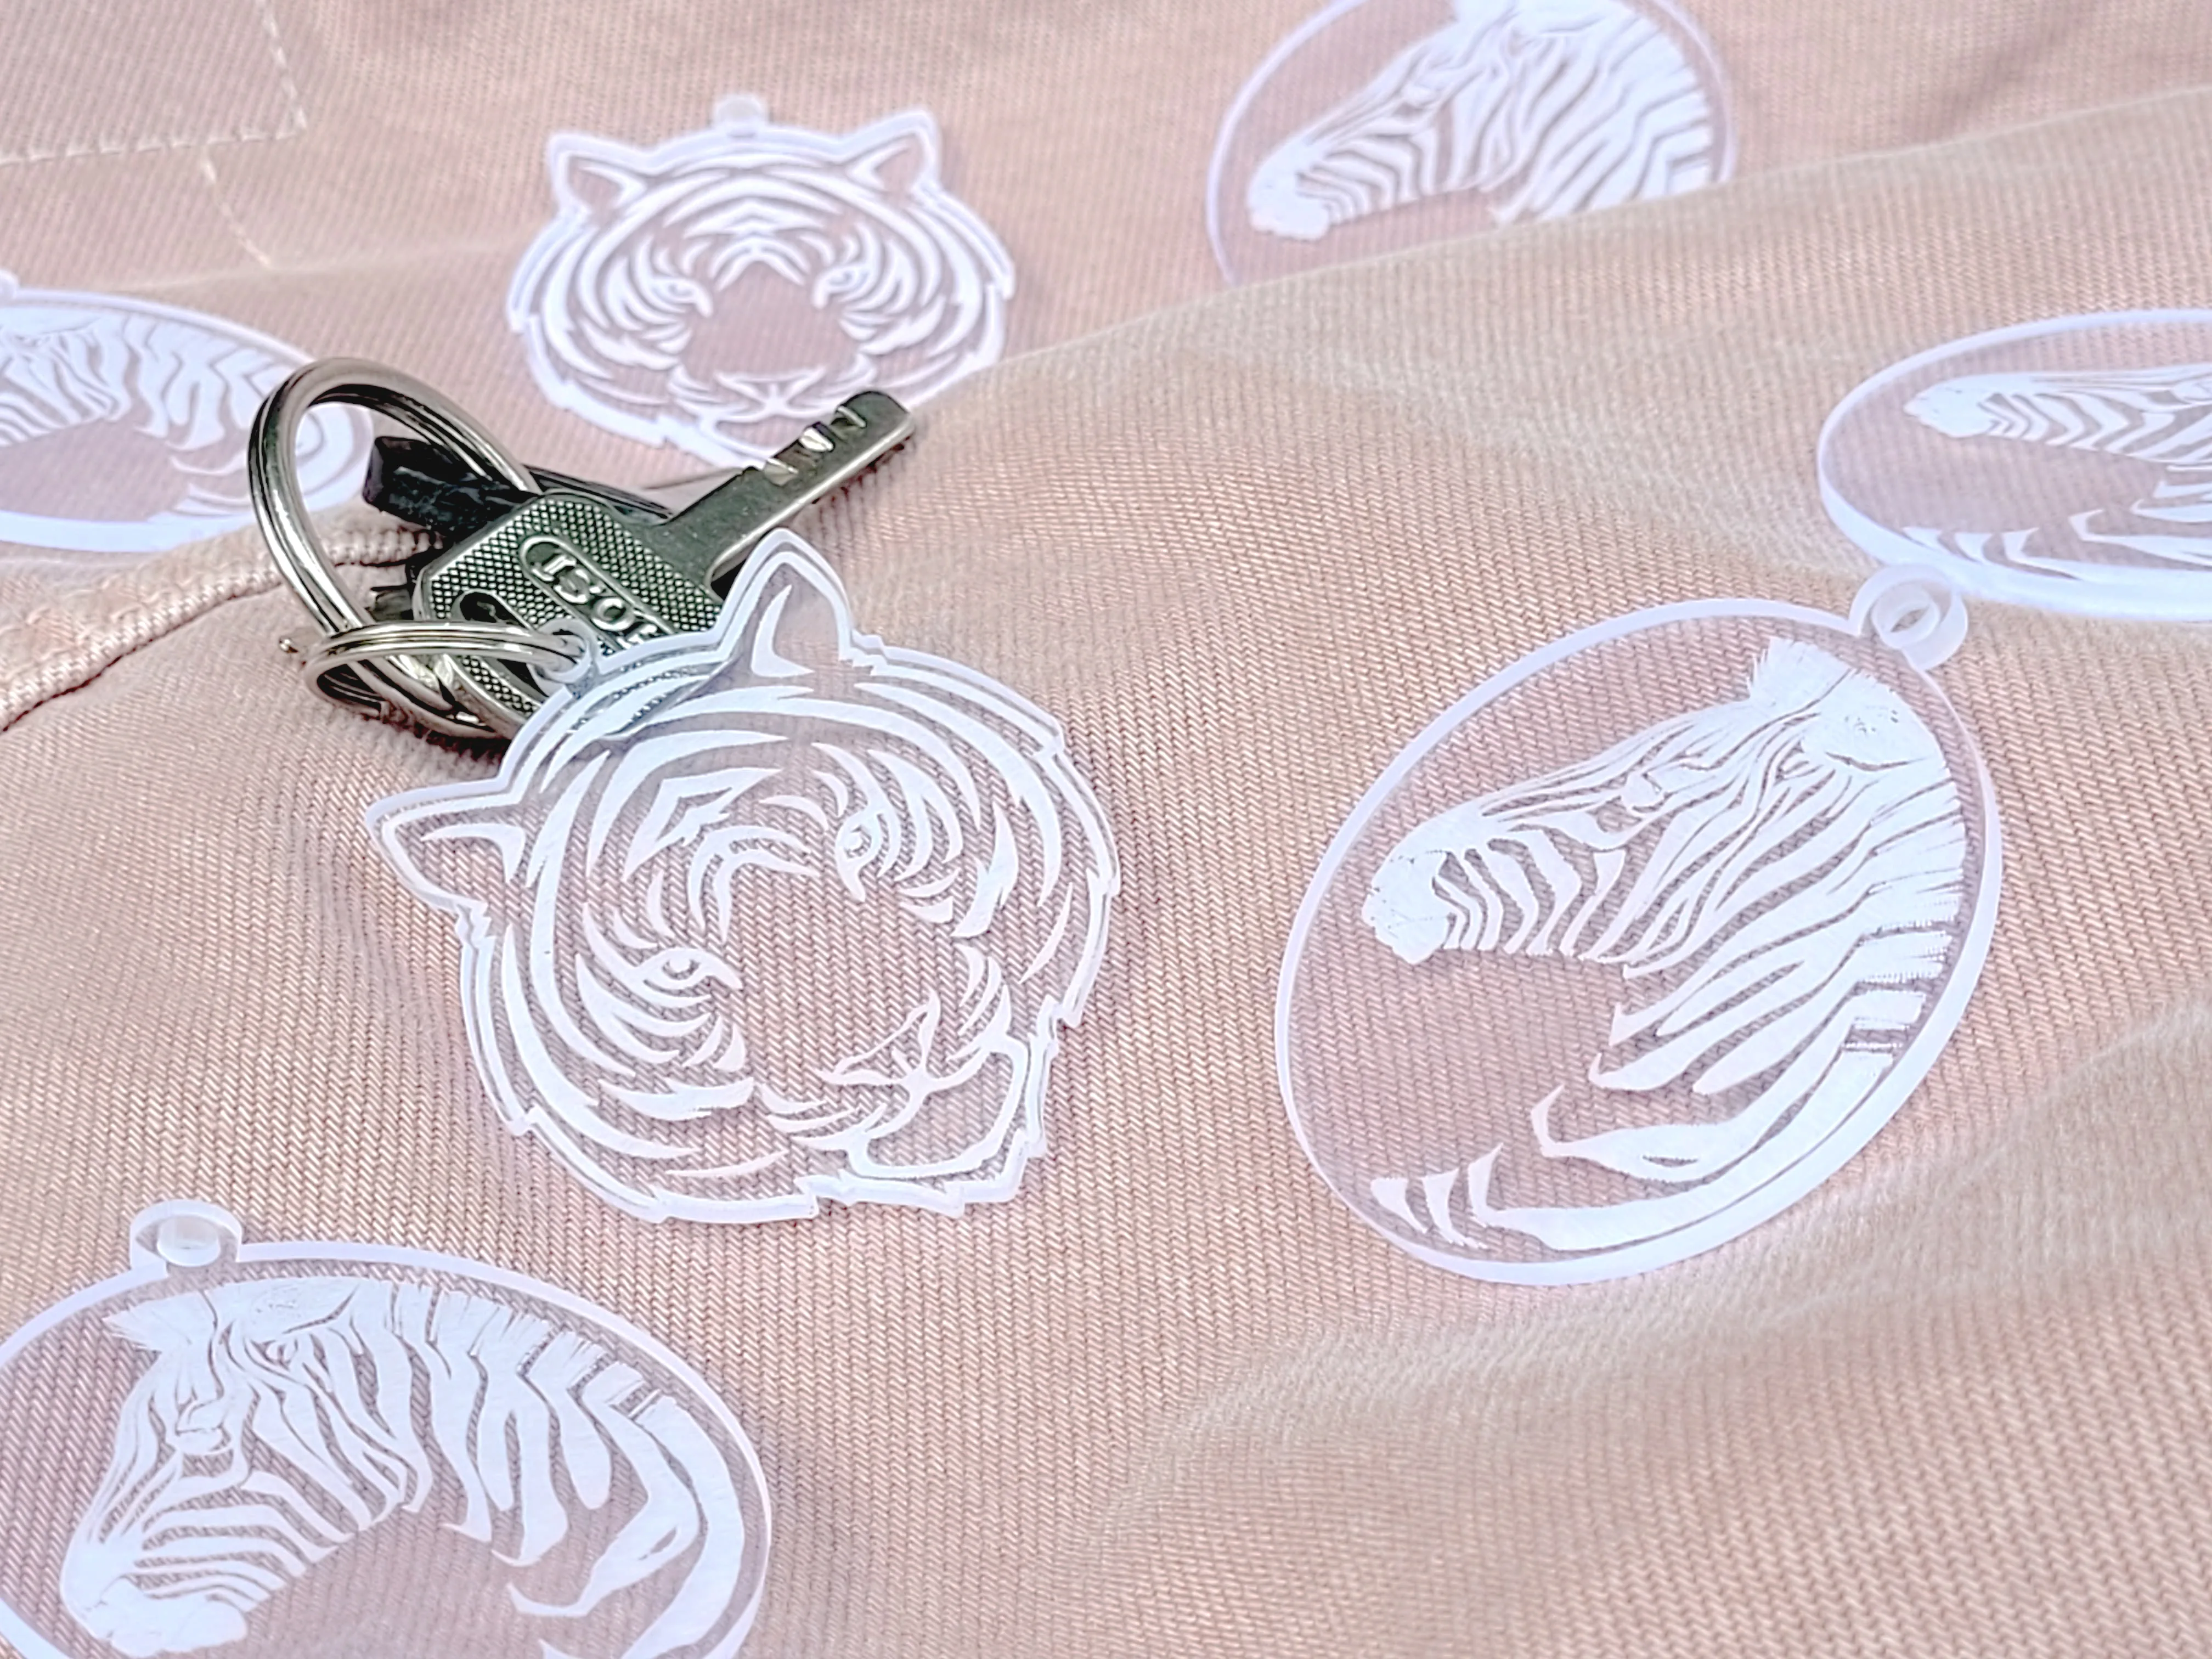
A ticket worth keeping. The entry ticket is redesigned as a collectible. It promotes four things:
- Drawing competition. Each month, children can send in drawings of the animal of the month.
- The RGZP app. Installing the app gives visitors discounts at the souvenir shop.
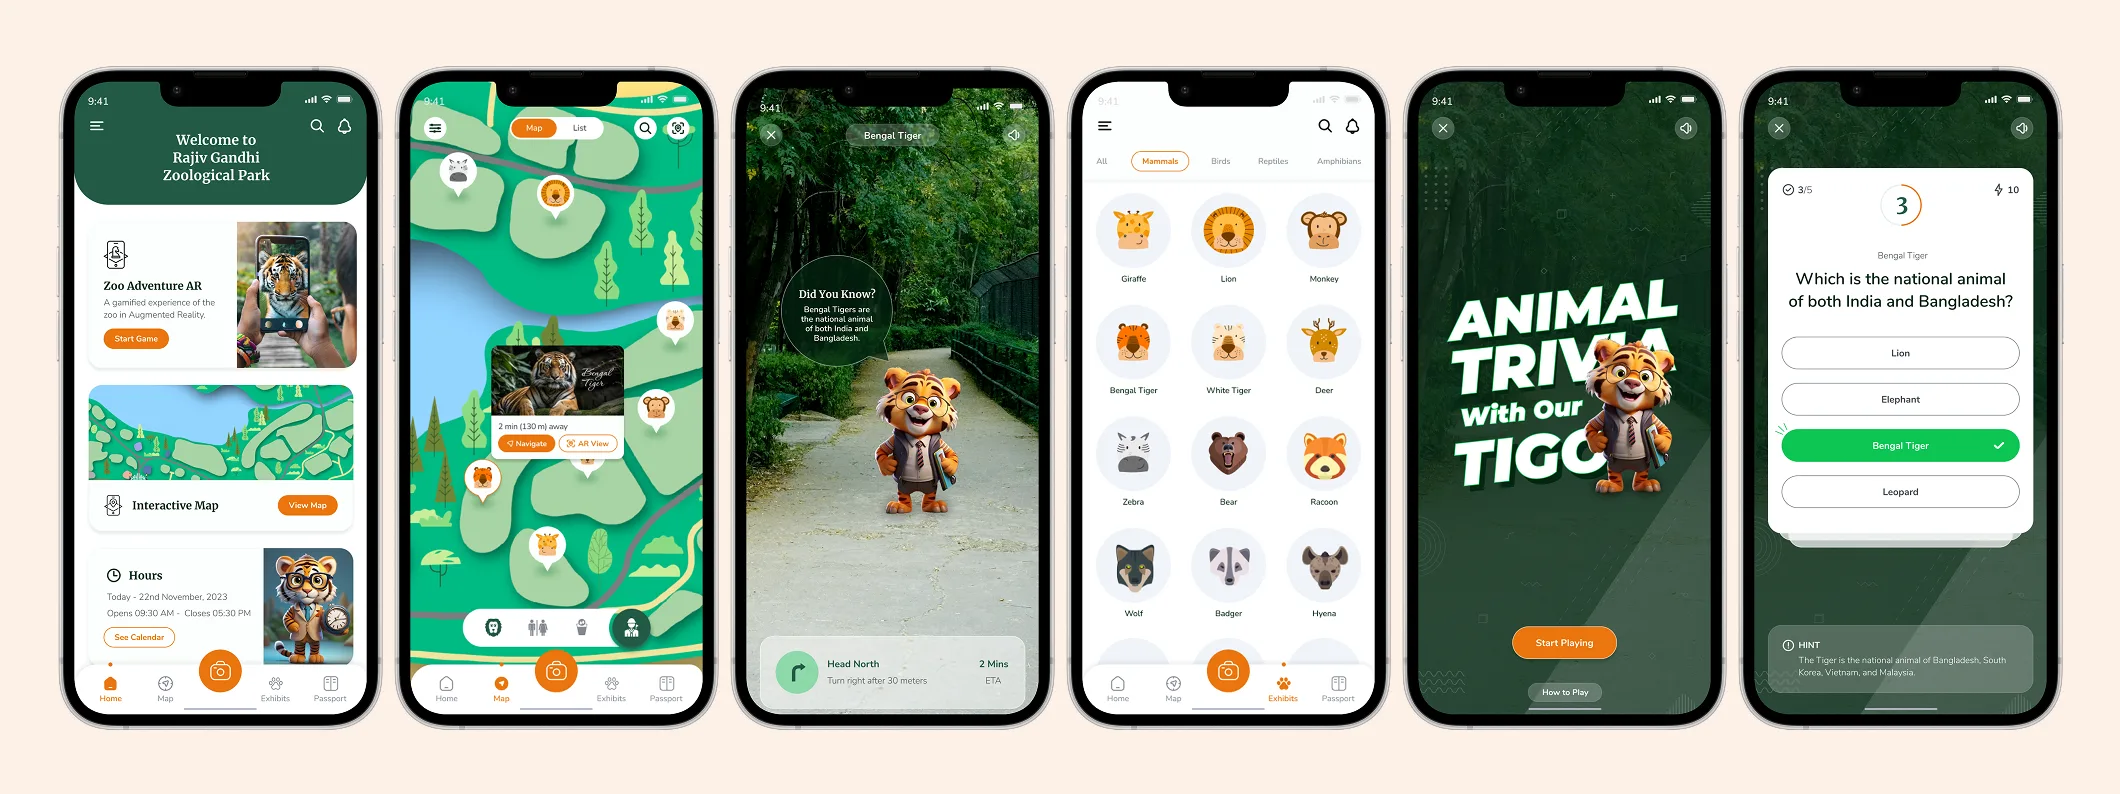
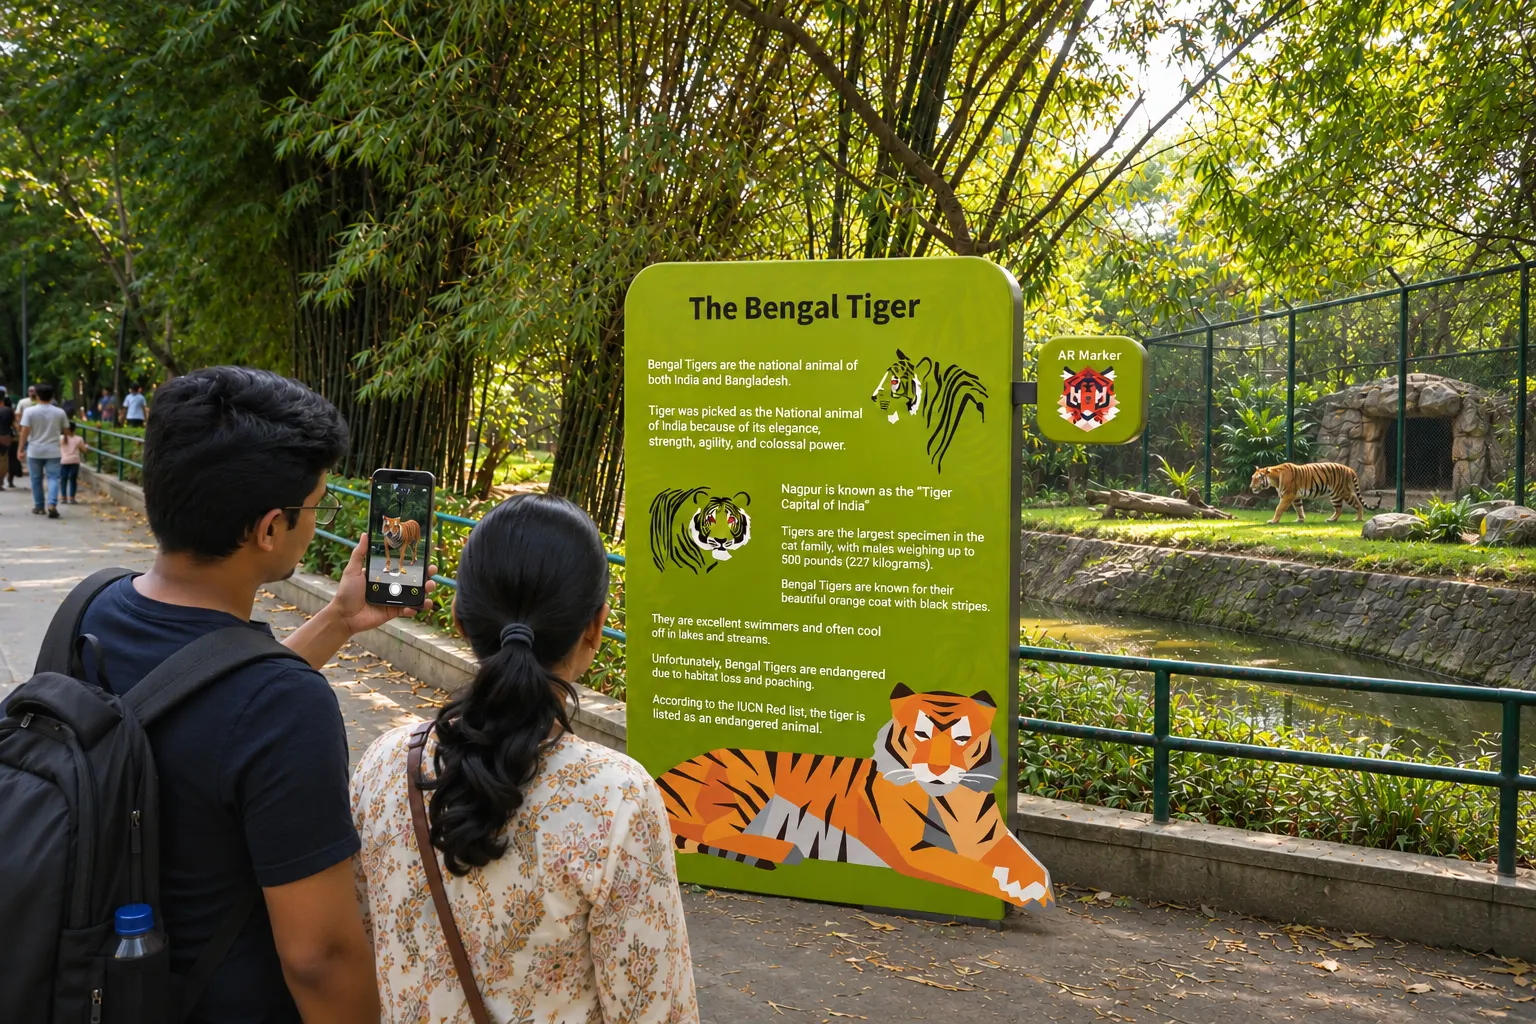
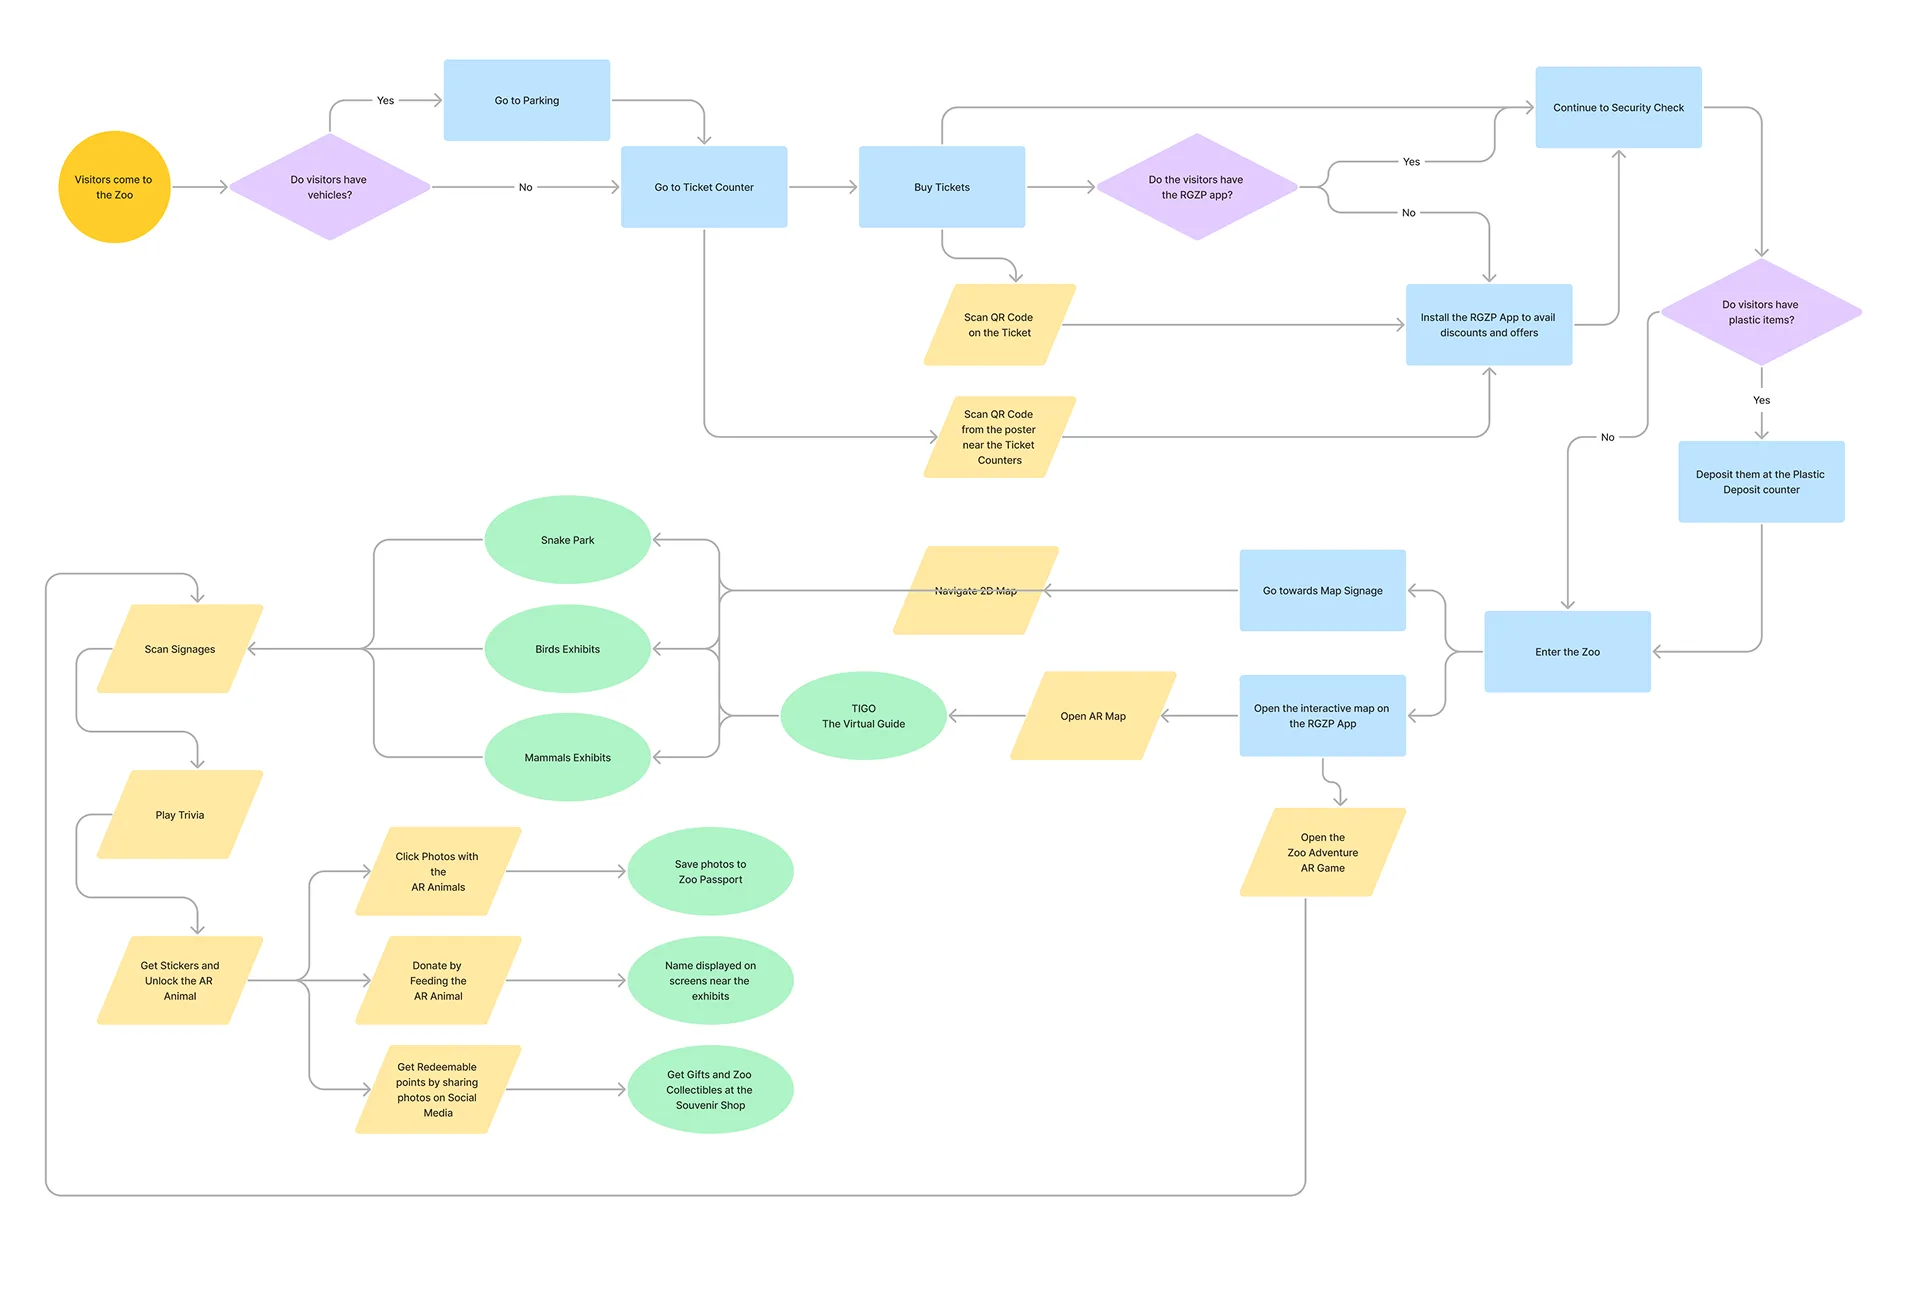
- Tigo, the new mascot. Tigo helps visitors find their way around the zoo with AR maps and keeps them engaged along the way.
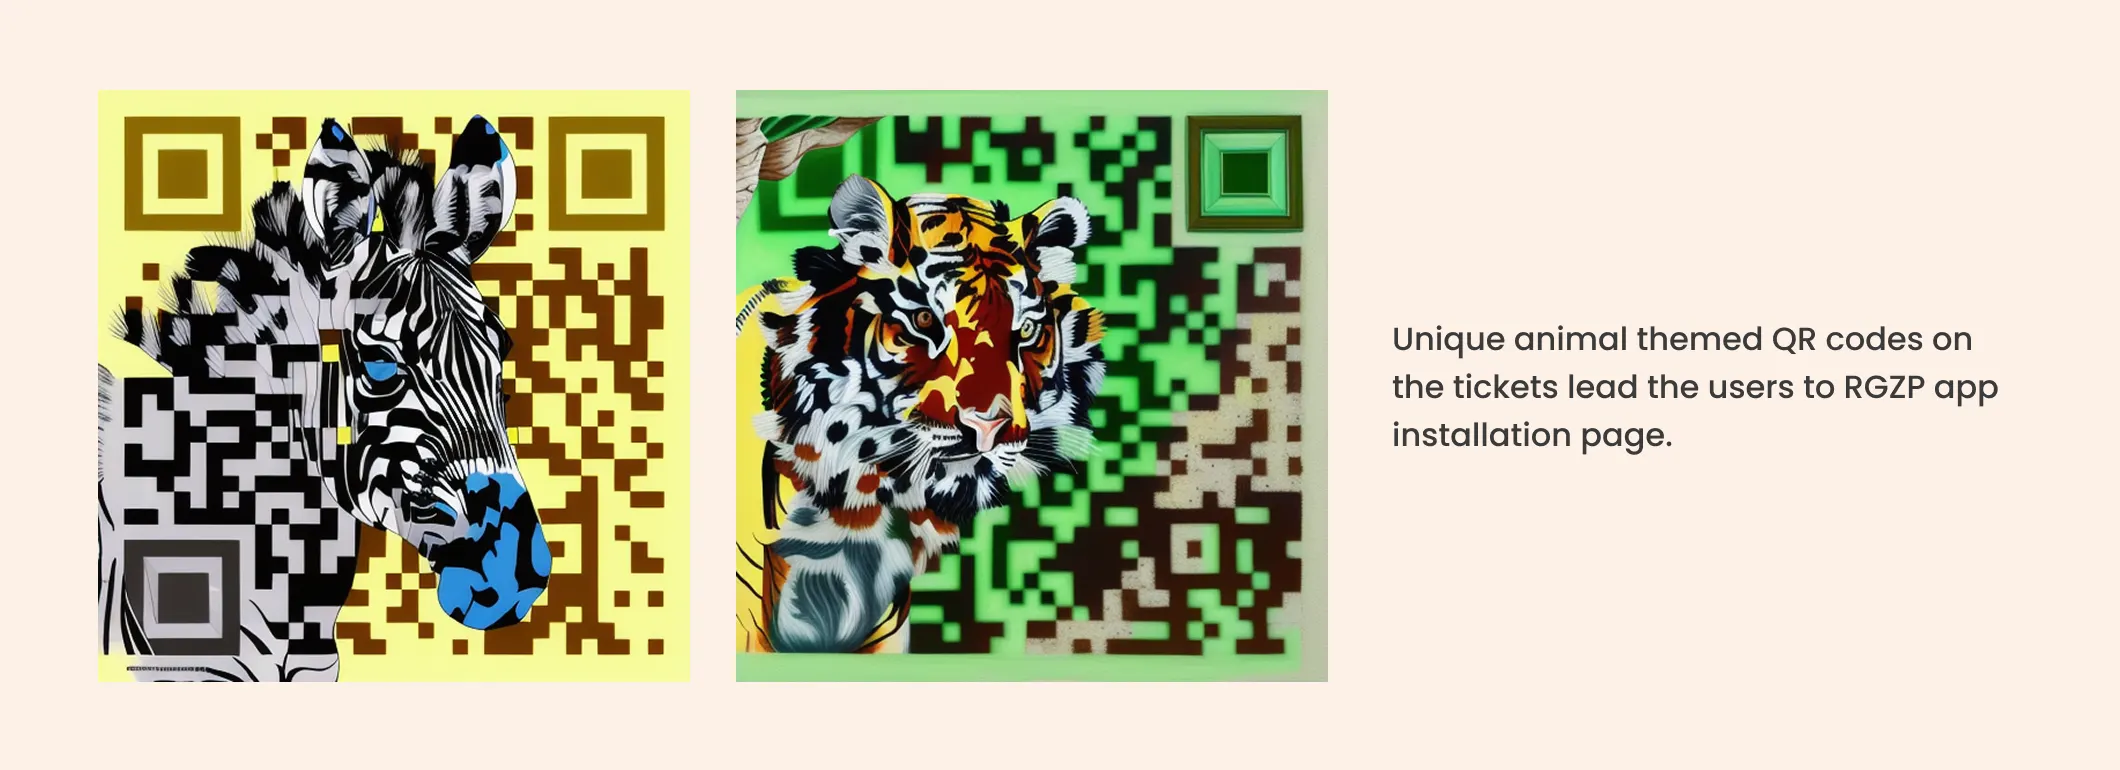
- Themed QR codes. Each ticket carries a unique animal-themed QR code that leads to the app’s install page.
The RGZP app. The app has three features:
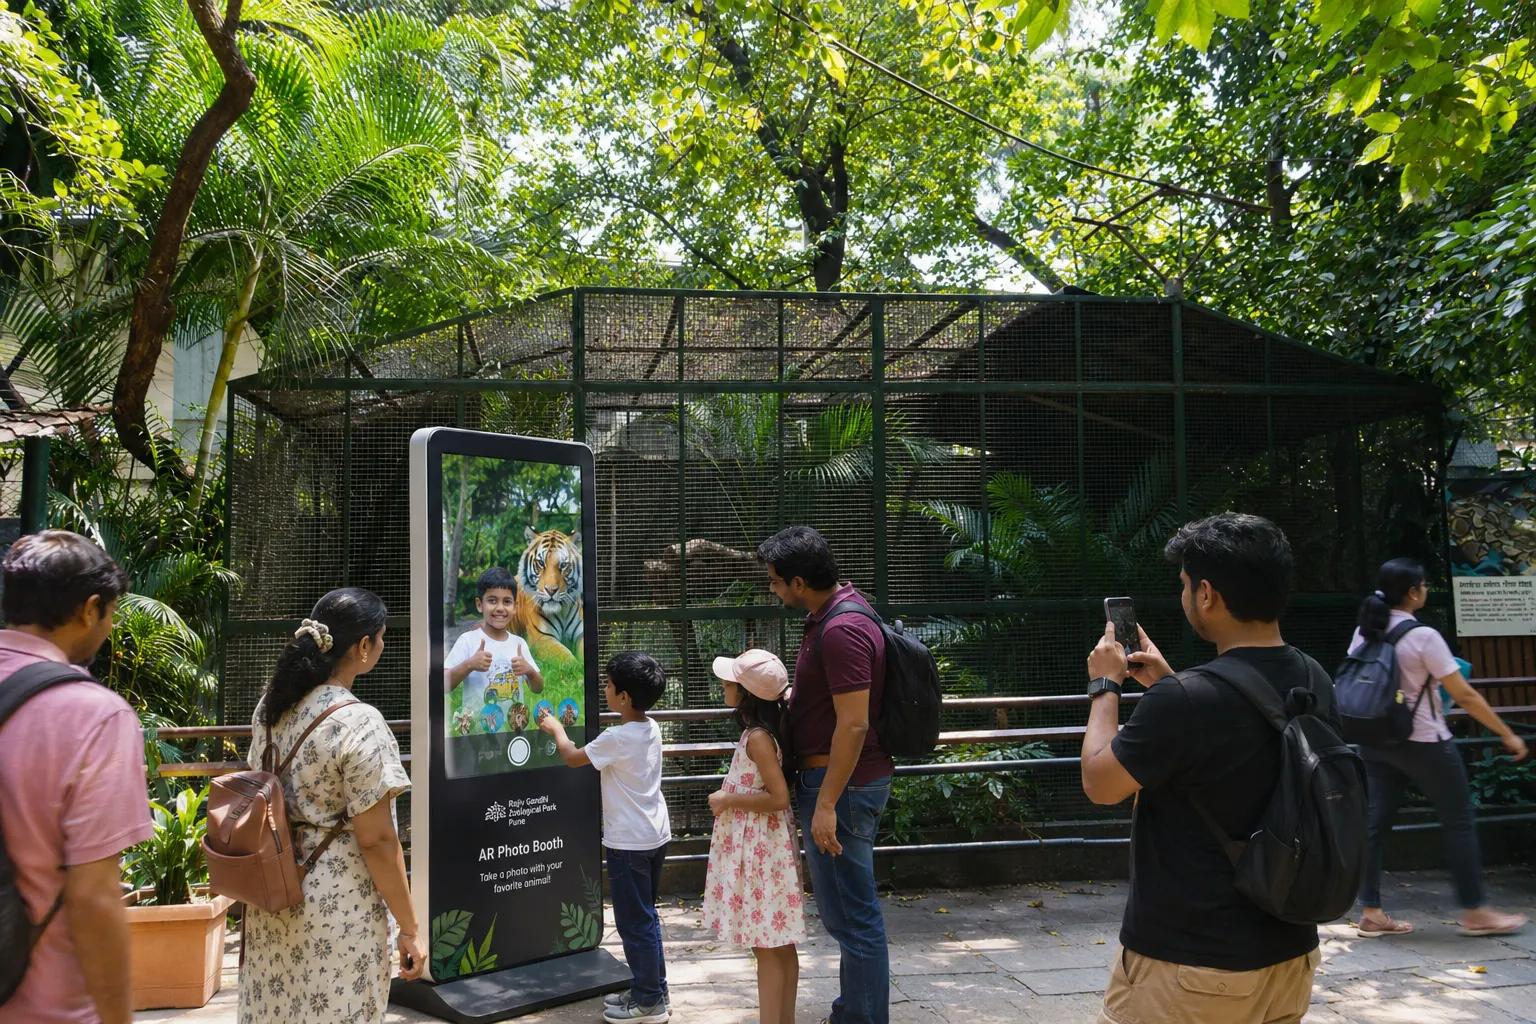
- Zoo Adventure AR. A game for children that combines AR and photography to teach them about the animals in the zoo. Children play quiz games and unlock AR animals to take photos with. Sharing a photo on social media earns a unique stamp in their passport.
- Interactive map. Visitors can find their way around the zoo with the map. In AR mode, Tigo guides them. He knows his way around and shares interesting facts about the animals along the way.
- Events calendar. A section lists the events planned at the zoo.
New visitor journey flow
Outcome and learnings
Status: Concept and interactive prototype.
What I learned
- Many visitor problems start in the relationships between the parts of the system, not in a single touchpoint.
- Mapping who depends on whom revealed opportunities that traditional research could have missed.
- Small interventions can have a wider effect across a complex system.
- Systems thinking moves design decisions from symptoms to root causes.